Things We Are Looking At – Is a Major Decline Imminent?
November 7, 2025
To Inform:
Investors are seeming jittery right now. This week I received a few communications from clients wanting to hear our take on a potential major market decline. One client said, “I’m feeling a little jumpy!” Another client sent me an ominous looking chart showing trend lines going back the Great Depression in 1929 with the implication the next depression could be right around the corner. We’ve seen LOTS of charts like this one before and believe such charts are more noise than signal.
We agree the world is nutty right now. We are in the midst of a long government shutdown, the Supreme Court is debating tariffs, and the mainstream U.S. stock market is expensive based on multiple valuation metrics. We are always cognizant of a potential market correction and in diversified portfolios we have the privilege of managing for clients, we are including things like hedged stock positions and insurance-linked bonds which have no correlation to stocks in order to diversify portfolios.
All of that said, our job is to be logical when others are emotional. I’d like to share a few things we are looking at as we have conversations in our Investment Strategy Team meetings.
Stock Valuations Are More Reasonable Outside of the Largest U.S. Companies
We like the perspective of the valuation chart below. The Price to Earnings or P/E ratio conveys how much investors are paying for every dollar of earnings from a company or market index. The largest 5 companies in the S&P 500 have an average P/E ratio of 30.2 (gray line), which means investors are effectively paying $30.20 for every dollar of earnings produced by these companies. We would agree this is historically expensive, but when we look at the rest of the market (the average stock in the S&P 500, blue line) the P/E ratio is a much more reasonable 19.

Source: Strategas Research Partners
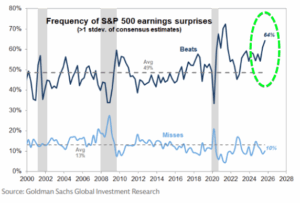
Earnings Are Trouncing Expectations
We believe this one is important. While volatility is always part of investing and we could get a correction (commonly defined as a -10% decline) at any time, a major decline typically does not happen without a contraction in earnings and we are simply not seeing it. In fact, earnings results for the 3rd quarter have come in above analyst’s expectations at one of the highest rates on record. Goldman Sachs says, “in our 25-year data history, this frequency of earnings surprises has been surpassed only during the COVID reopening period in 2020-2021.” Strategas Research Partners states, “3Q reporting season results have come in upbeat, with roughly 14% y/y growth relative to initial expectations of mid-single digits.”
We go back to one of our TJG mantras that the market tends to respond more to “better or worse” than “good or bad.” Earnings this quarter are not only coming in “good”, but they are coming in even “better” than expected.
Source: Goldman Sachs, Hamilton Lane
Credit Conditions Remain Healthy
When we are looking for signs of stress in the markets, we love to look at “credit spreads” or the amount of interest investors are looking to earn over and above government bond rates as compensation for bankruptcy risk. Currently, high yield spreads are about 3%, implying investors are looking to earn about 3% over government bonds as compensation for the risk of default. Historically, this is a low level and implies little concern about bankruptcy risk. “Credit stress” most often starts to become a concern at 4-5% rates and we are getting reports daily looking at these numbers. The chart below, from Strategas, came this morning and they are watching the 3.5% level as a stress indicator. If credit spreads were to rise above that level, it could signal cause for concern – we are not there yet.

Source: Strategas Research Partners
Sentiment is Neutral and Is NOT Flashing a Warning Sign
It’s been a while since we’ve talked about one of our favorite investment sentiment indicators – the Smart Money/Dumb Money Indicator. Basically, the idea is to follow the “Smart Money” investors (e.g., commercial hedgers, institutional options traders) and do the opposite of the more emotional “Dumb Money” investors (e.g., individuals, small speculators). When these two groups are at opposite extremes, it can be an important buy or sell signal. The rest of the time, the indicator is more “noise.” Currently, neither group is at an extreme and we would rate the “signal” here as neutral.

Source: Sentimentrader.com
Market volatility is normal and as I am typing on Friday morning, stocks and bonds are having a weak open and I’m seeing more red on my screen for the major indexes (but with a number of individual stocks in the green!). What we are focused on here are things which could be warning signs for a major decline. While we are looking for changes and diversification is always important to help mitigate surprises, strong earnings growth, healthy credit spreads, and neutral sentiment are all encouraging signs for the current market environment.

Writeen by Travis Upton, Partner and CEO