Answering Questions When Markets are Volatile
May 14, 2021
To Inform:
This past week has been a wild ride for the stock market. On Tuesday (5/11) and Wednesday (5/12), the popular Dow Jones Industrial Average was down over -300 points and -600 points respectively. Of course, with the Dow hovering around 34,000, -600 points isn’t what is used to be in percentage terms, but it still attracts attention. When investors see attention grabbing market declines, they typically ask one of two questions:
- Should I sell?
- Should I buy?
Those questions are clearly diametrically opposed, but it is the reality of where our minds go. When the market is down, we want to know if it might get worse (should I sell now?) or if the dip is temporary (should I buy now?). Let’s unpack the key things The Joseph Group’s Investment Strategy Team was looking at on Wednesday to answer these questions.
Should I Sell?
Investment people often speak a different language. Here is an actual conversation I shared with TJG Portfolio Manager Alex Durbin on Wednesday:
- Travis: Wow, ugly day in stocks, how’s credit?
- Alex: Junk is down 30 basis points.
- Travis: How about the Agg?
- Alex: Agg is down 32 basis points, credit is good.
- Travis: Got it. Did you go to the North Market for lunch today?
So what the heck were we talking about? One of the first things we want to do when we see volatility in stocks is get a sense of what is happening in other areas of the financial markets, something known as cross-market analysis. The first place we look is in “credit,” or the market for high yield corporate bonds. A deterioration in credit is often an early warning signal of potentially bigger problems in the broader economy. In our conversation, Alex and I were looking at the difference in behavior between junk bonds and high quality bonds (with high quality being measured by the Barclays’ Aggregate Bond Index). Because there was essentially no difference in behavior (both the index for junk and high quality bonds were down about -0.30%) it told us there was no change in credit conditions. When we are conducting cross-market analysis, credit markets tend to be more logical and less prone to investor emotions than stocks. Even though the Dow was down -600 points, the more logical credit markets were barely moving, pointing us to the conclusion stocks were being overly emotional.
It’s worth noting the next morning, we received a report from Strategas Research Partners showing a chart of the trend in credit conditions with the headline “Credit Still OK,” and supporting the conclusion there weren’t signs pointing to something potentially more sinister happening in markets.
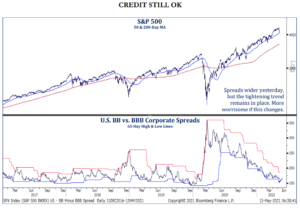
Source: Strategas Research Partners 5/13/2021
Should I Buy?
So, credit looks healthy so it’s probably not time to sell, but what about the other question, should I buy? One of our favorite things to look at for “buy signals” is investor sentiment. We want to be selling when investors are greedy and buying when investors are fearful. That’s easy to say but more difficult to put into practice. In general, we believe sentiment is not a great timing indicator to sell for market tops (in other words, greedy conditions can go on for a LONG time), but it can be good for a higher likelihood of success as a buy signal when there is fear in the market.
Below is a chart of our favorite sentiment indicator, the Smart Money/Dumb Money Confidence. The idea is to follow the smart money institutional investors and do the opposite of the more dumb money emotional individual investors. Most of the time, the behavior is just noise, but when the two are acting in opposite extremes, it can be noteworthy.
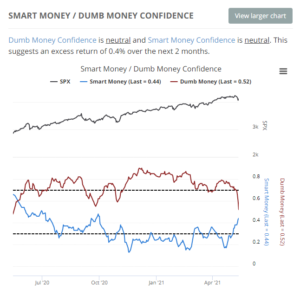
Source: SentimenTrader.com
The red “dumb money” has been optimistic and the blue “smart money” has been cautious basically since the election, supporting our point that sentiment is not a great indicator on the sell side. However, we did see things change in recent days with the dumb money selling and the smart money buying as the two lines move the middle. What we really want to see for a buy signal is the lines crossing with he blue moving up and the red moving down. It moved in the right direction the last two days, but more to a neutral level and not enough to indicate a “fat pitch” buying opportunity. In other words, buying is looking more interesting, but it’s probably still too soon.
Putting it All Together
So, in the midst of the volatility this week, cross market analysis was suggesting “don’t sell” and sentiment was indicating “it’s too soon to buy.” Does that mean the right answer to the two questions is do nothing? Sort of. Volatility is part of investing. According to research from Capital Group, a stock market decline of -5% happens on average three times a year and lasts for about 43 days. In other words, if we are looking at quarterly statements, we may not even notice it. However, when markets are volatile, we would suggest the best right answer is not just to “do nothing” but instead ask a third question: “Does my strategy still make sense for my needs?” If the answer is yes, you aren’t “doing nothing,” you are making a purposeful decision to align your investment decision-making with your objectives. By the way, the market was up Thursday and is up so far on Friday, so overall, it’s ended up being a pretty flat week.

Written by Travis Upton, Partner, CEO and Chief Investment Officer