
Asset Class Roundup
July 17, 2026
To Inform:
When I’m looking at returns for the objectives-based portfolios we have the privilege of managing for clients, I find it informative to look at the underlying asset classes to see which have contributed most to the return and which have been laggards. I also find it helpful to look forward and think about how those asset classes are positioned to perform going forward. Let’s do an “asset class roundup” and talk about asset class returns year to date (YTD through 7/16) and make some comments about positioning going forward.
High Quality Bonds
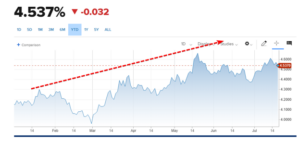
Bonds have been the biggest asset class laggard so far in 2026 with the Bloomberg Aggregate Bond Index (“the Agg”) up only +0.27% YTD. The Agg has an income yield of close to 5%. However, we always like to tell clients the relationship between market interest rates and bond prices is like two ends of a teeter-totter. As shown in the chart below, the rate on the 10-year Treasury note was 4.15% at the start of the year but is 4.54% today. Rising rates at one end of the teeter-totter has meant downward pressure on bond prices at the other end.
Source: CNBC.com
Looking forward, higher rates should lead to higher return bonds; that’s not a prediction, it’s just math. We believe bonds play an important role in providing ballast to a portfolio when there is market volatility and higher rates only bolster that case going forward.
Credit/High Yield Bonds
We look at “Credit,” the name we give to high yield, or junk bonds, separately from High Quality Bonds because they have a different risk exposure. “Credit” is more sensitive to default risk and less sensitive to changes in market interest rates.
YTD, the Bloomberg High Yield Index is up about 2.1%, which is better than High Quality Bonds, but not as exciting as stocks.
Looking forward, we like to look at the “spread” on credit, or high yield bond which reflects the amount of interest over and above government bond rates. As seen in the chart below, the current spread is 2.71%, which is the low for the last five years.

Source: ICE Data Indices, Federal Reserve Economic Database
Looking forward, we can do some math and add the 2.71% rate to 4.50% rates on government bonds to get a ballpark yield of about 7.2%. Compared to the conservative assumptions we use in client financial plans, we like a starting income yield of 7.2% but would rather get more aggressive in our use of high yield bonds when “spreads” are higher than they are today.
US Stocks
As I’m typing, stocks are down at today’s market open, reminding us the market can be volatile, but despite volatility, stocks have been among the strongest asset class performers YTD. The S&P 500 is up +10.7% so far for the year, and the equal-weight S&P 500, which gives an equal percentage to all 500 companies in the index rather than weighting by size, is up slightly more, up +13.2%. The biggest winner in the U.S. stock market overall though is small caps with the Russell 2000 small cap stock index up over 20% so far for the year.
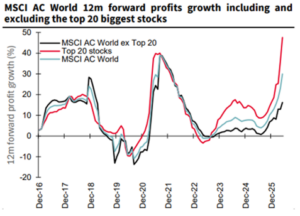
Looking forward, we’ve had the question, “with the war going on, how is the market doing so well?” The answer – it’s earnings. No matter how you slice it, corporate earnings growth has been fantastic. As long as earnings growth continues, the stock market should have solid fundamental support.
Source: Bloomberg
Foreign Stocks
Foreign stocks have also played a strong role in supporting portfolio returns. YTD, the MSCI EAFE Index of developed country stocks (think European countries and Japan) is up +9.8%, while the MSCI Emerging Market Index (think Taiwan, South Korea, China, and India) is up +17.9%.
Looking forward, one note we think is important is the technology exposure within emerging markets (EM). While big computer chip companies in the U.S. have garnered the most attention, semiconductors and technology companies also make up a significant portion of the emerging market index. We believe the implication here is that EM may not offer as much “diversification” going forward. Why? The ups and downs of the technology sector may impact EM just as much as it does the U.S. market.
Real Assets
We look at Real Assets as a diversified mix of commodities, global real estate investment trusts, and infrastructure. YTD, an equally-weighted mix of these three asset classes is up over +13%, generating returns competitive with stocks.
Looking forward, a few members of The Joseph Group’s investment committee believe Real Assets could play an important role in portfolios. Not only do they offer exposure to assets which may benefit if inflation surprises to the upside, but the build-out of AI, robotics, and other technologies rely heavily on having stuff, moving stuff and building stuff. Real Assets could work in a variety of different scenarios.
TJG’s Chief Investment Officer, Alex Durbin, always reminds us that diversification usually means holding an asset class you don’t like. So far this year, bonds have been a drag on performance, but that hasn’t kept portfolios from largely exceeding the conservative return estimates we put in client financial plans. Looking forward, we remain focused on making portfolios “anti-fragile,” meaning portfolios which can work in a variety of different conditions. In other words, we’re going to be chasing our clients’ objectives, not what have been the hot performers over the last few months.

Written by Travis Upton, Partner and CEO