Asset Classes – What’s Working and Not Working So Far in 2021
March 11, 2021
To Inform:
Before we dive in, let’s provide some background. Clients of The Joseph Group know when we talk about “asset classes,” we don’t just focus on stocks and bonds. We divide up the asset allocation pie chart into five different categories in an effort to clarify the purpose of the asset class in the portfolio, as well as the “risk driver,” or main factor that will make the asset class move up and down. Here is a brief description of those five asset categories:
- High Quality Bonds provide income and protection in a deflationary (falling price) environment. The biggest factor which makes prices move up and down is interest rates, where there is an opposite relationship. As interest rates move up, bond prices move down and vice versa.
- Credit is a term we use for lower quality bonds issued by companies which may have less than pristine credit quality. These bonds pay a high rate of income and can provide growth in an improving economy; however, prices are sensitive to default, or bankruptcy risk.
- Global Stocks seek to provide long term growth of capital and are sensitive to market risk as well as industry/company specific factors.
- Real Assets are things like commodities, real estate and infrastructure (think pipelines, cell towers and toll roads). Real assets can provide long term growth, but also have characteristics which make them more sensitive to changes in inflation.
- Dynamic Allocation strategies come in many different forms and generally provide wide flexibility to individual managers. Dynamic strategies can provide growth, diversification and potentially hedge market risks, but the risk driver is at the strategy and manager risk levels.
One of the big picture things the Joseph Group’s Investment Strategy Team (IST) looks at every meeting is performance across these broad asset categories over different time periods. So far in 2021 (YTD through 3/9) the best performing category is Real Assets and the worst performer is High Quality Bonds with the other three asset classes in the middle. Let’s look at the two extremes of what is working and not working.
What’s Working: Real Assets
The Joseph Group’s internal benchmark for Real Assets is 1/3 Commodities, 1/3 Global Real Estate, and 1/3 Global Infrastructure. So far in 2021 (through 3/9) the blend of the three is up a bit more than 4%, more than any other broad asset class. It’s informative though to unpack the pieces. Based on index numbers, Global Infrastructure is essentially flat, Global Real Estate is performing roughly in line with stocks, but commodities (as measured by the Bloomberg Commodity Index) are up over 9%. In other words, commodities are the dominant contributor.
Commodities are probably the asset class most sensitive to inflation because commodities reflect the direct inputs to things we build, eat, and do. Looking across the commodity complex, virtually every area has moved higher so far in 2021 including food (corn, coffee, soybeans), industrial metals (copper, nickel), textiles (cotton), and especially energy. The chart below shows the YTD performance of West Texas Intermediate (WTI) crude oil, which started the year around $48/barrel and is trading today around $64/barrel, reflecting an increase of 33%.
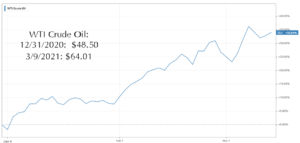
Source: Koyfin
What do we make of the Real Asset/Commodity leadership? Not only have we had an unprecedented amount of fiscal and monetary stimulus pumping up the money supply, but vaccine distribution presents the prospect of a return to a more “real economy.” Ideally, more people will be driving, traveling, buying clothes, and eating out. In our minds, “real economy = real assets” and current market leadership is affirming that view.
What’s Not Working: High Quality Bonds
The interest rate on the 10-year Treasury note has increased from 0.92% on 12/31/2020 to 1.55% on 3/9/2021. Since bond prices have an opposite relationship with interest rates (like a teeter-totter), rates going up as meant bond prices have gone down. So far in 2021 (through 3/9) the Barcap Aggregate Bond Index is down over -2.9%.
Bonds are usually thought of as “conservative” investments and this kind of decline is rare. It’s so rare that the first two months of 2021 rank as the 2nd worst start to a year for bonds going back to 1926!
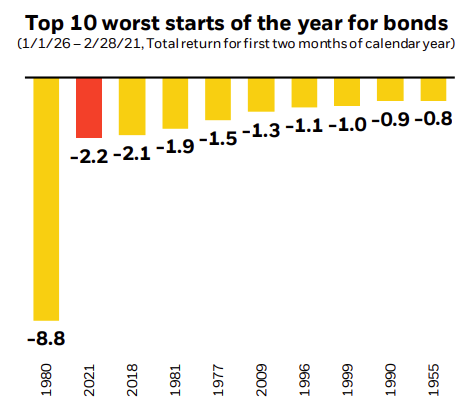
Source: BlackRock Student of the Market as of 2/28/2021
Seeing the chart above begs the question, if rates are rising and bond prices are going down, are they likely to keep going down? History would say the answer is no. According to Blackrock, in every instance when bonds had their roughest January and February, the remaining 10 months of the year were positive every time. We think this is an important consideration when it comes to rebalancing and asset allocation decisions.
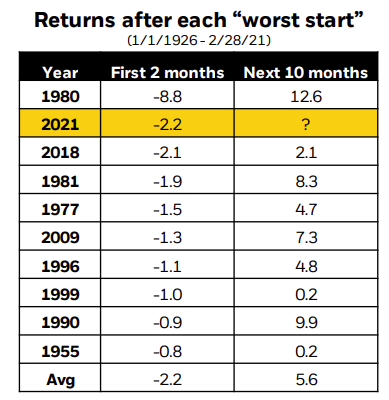
Source: BlackRock Student of the Market
Putting it all together, we believe Real Asset strength and High Quality Bond weakness are opposite sides of the same coin. Higher inflation expectations and actual and expected increases in real economic output are providing a lift to commodity prices, but also acting as a catalyst for rising interest rates. As always, our own views on these asset categories reflect the role they play in addressing client objectives. In inflationary times, we expect Real Assets to benefit from recovering growth and serve as a hedge against inflation in financial plans. When it comes to High Quality Bonds, we are underweight in our strategic allocations, but recognize bonds have “insurance value” against stock market declines and the higher rates go, the more attractive bonds look relative to cash.
Have a great week!

Written by Travis Upton, Partner, CEO and Chief Investment Officer