
Bonds: The Twilight Zone Edition
October 2, 2026
To Inform:
“You’re traveling through another dimension, a dimension not only of sight and sound, but of mind.” In this week’s episode of Wealthnotes we’re going to take a page out of Rod Serling’s book and picture a scenario where investors travel through another dimension, to September 2021. Five years ago, stocks had recovered all their COVID losses and then some and inflation was still, according to the Federal Reserve, “transitory.” Interest rates hadn’t yet taken off on their ride into the stratosphere, with the Fed Funds rate still at 0% and the US 10-Year Treasury Bond yielding around 1.5%.
Having traveled through time and knowing the future would be of tremendous value for an investor. But, in 2021 an investor didn’t need to be from the future to have a good sense as to how bond market returns would play out. In fact, there’s one simple tool that would have helped investors predict with quite a bit of precision what future bond returns were going to look like.
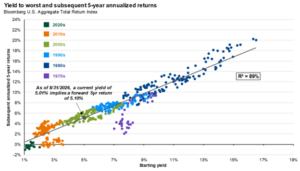
That tool is the starting yield of bonds at a given point in time. The chart below illustrates this with the horizontal axis showing the starting yield of the U.S. Aggregate Bond Index and the vertical axis shows the realized return over the next five years. The geeky “R²” figure means that close to 90% of the returns can be explained by the starting yield, the remaining 10% by other factors.
Source: JPMorgan Asset Management
Five years ago, the starting yield of the US Aggregate Bond Index was around 1.6% and the subsequent 5-year return through September 2026 was -0.2% annualized. Remember earlier where we saw that that starting yields explain about 90% of the subsequent realized return? The remaining 10% is explained by things like the speed of interest rate increases and the rate increase relative to the starting yield. Interest rates have a “teeter-totter” relationship with bonds. As rates go up, bond prices go down. This is particularly painful when starting yields are low and there is very little bond interest to offset the decline in bond prices as was the case in 2021, which is why subsequent returns were close to 2% lower than the starting yield.
Bond yields have been a pain point lately, with the rates rising relentlessly through September. Many bond investors are beginning to think, “here we go again.” But there is a silver lining today that didn’t exist in 2021: substantially higher coupons (the interest a bond holder receives).
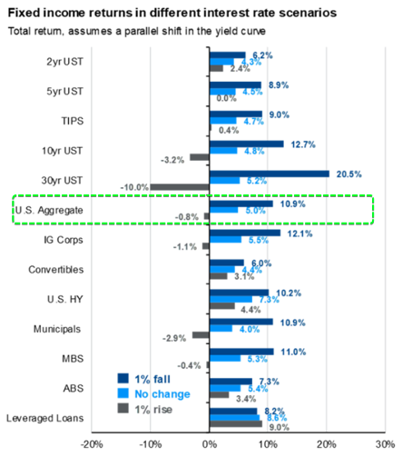
The chart below helps illustrate the positive effect higher bond coupons provide. Assuming a 1% increase in bond yields, investors in the US Aggregate Bond Index could expect to be down less than 1% over the course of the next year. While bond prices decline in this scenario, coupons offset most of that. At the starting yields in 2021, the same move in rates would have led to around a 5% decline in bonds, as there was very little coupon to offset the decline. This chart also shows what happens If rates fall (all else being equal) by 1%: coupons and bond price appreciation result in a scenario where bonds are up close to 11%.
Source: JPMorgan Asset Management
We don’t have the benefit of time travel, but the math tells us that forward returns are likely to be a lot better these next several years than they have been over the last five years. Whether we’re looking at the US Aggregate Bond Index, municipal bonds (a story for another day!), or things like inflation-protected bonds, the benefit of higher starting bond yields on financial plans is something we haven’t seen in a long time. Serling might have signed off from this note with a moral flourish, something to the effect of “to confidently invest for the future, bond investors needn’t travel through space and time: they need to do something perhaps more difficult yet remarkably simple – that is to proceed with patience, something the successful investor cultivates and the less successful always find to be short in supply.”

Written by Alex Durbin, CFA, Partner and Chief Investment Officer