How Am I Doing? – Three Levels of Benchmarking
August 18, 2021
To Inform:
When investors look at the returns on their portfolios, they want to know, “How am I doing?” Although it’s a simple question, from experience, we know there could be multiple meanings behind the question. “How am I doing?” could mean:
- Am I making money?
- Am I reaching my goals?
- Are other investors doing better than I am?
- How am I doing against a benchmark?
Evaluating investment performance across the objective-based strategies we have the privilege of managing for our clients is an essential part of The Joseph Group’s investment process. Specifically, we have three levels of benchmarking we employ across all of our client’s portfolios.
Level 1: Target: Each of the objective-based portfolios we manage has an target return goal we are looking to achieve over a market cycle (typically 5-7 years). These target return goals are a key link between portfolios and planning because they factor into the returns we use in financial projections for clients.
For example, a common rule of thumb in the financial industry is “the 4% rule” which says under most circumstances, an investor can withdraw 4% of their savings annually, adjusted for inflation, and have a low risk of running out of money. We manage a strategy called Provision which seeks to provide current cash flow and is often used as a tool for funding retirement expenses. Being mindful of the 4% rule, Provision’s target return goal is 4%, meaning we are seeking to average 4% or more per year over a market cycle. While returns in any given year may be more or less than 4%, if we can achieve or exceed that return over a market cycle, we know clients are likely in good shape for meeting their cash flow objectives for that specific portion of their overall portfolio.
Level 2: Peer Group: We also compare each of the strategies we manage to a Morningstar Peer Group which reflects the actual performance of a group of fund managers who are managing money in a similar style. Each week, our Investment Strategy Team looks at performance across strategies and provides a report showing TJG performance, performance of the peer group, and any key differences between the two. Sometimes we may be doing things which are very different from the peer group in an effort to meet client goals (i.e., hedging risk, having more inflation protection) and we want to be able to articulate how these decisions are impacting performance in our clients’ accounts relative to other managers out there.
As an example, a strategy we call Harvest (think planting seeds today to reap a Harvest in the future) seeks risk managed growth to achieve long-term goals. The peer group we compare Harvest’s performance to is Morningstar’s World Allocation average which, like Harvest, contains managers who are using multiple asset classes and a global approach to achieving risk managed growth. By comparing the Harvest portfolio we manage to the peer group, we can assess whether we are taking more or less risk, and/or generating higher or lower returns for that risk compared to other managers out there.
While we may not always outperform the peer group in every strategy all of the time, if we can outperform managers who have a similar objective net of all expenses most of the time AND offer all of the other planning and services we provide, the result is a compelling value proposition for clients.
Level 3: Policy Portfolio Attribution: The final level of benchmarking is where we get a little nerdy (don’t worry – we won’t try to explain the chart). We have constructed a static hypothetical portfolio of index funds, which we call a “policy portfolio,” which we use as an internal benchmark for each of the strategies we manage for clients. We then use that policy portfolio benchmark as a basis for “attribution,” which is a fancy term for measuring the impact of our active management decisions.
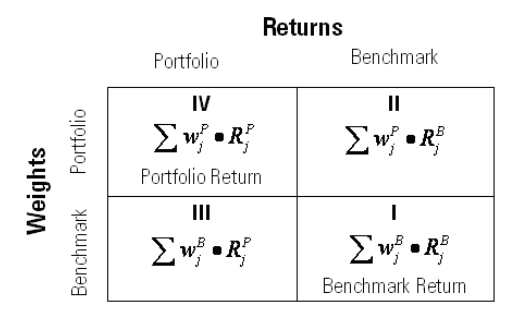
Source: Morningstar, 1 Brinson, Gary P., L. Randolph Hood, and Gilbert L. Beebower, “Determinants of Portfolio Performance,” Financial Analysts Journal, July-August 1986, pp. 39-44.
When we are making decisions to overweight or underweight a specific asset class, or use an active fund manager over an index fund, we are making purposeful deviations from the policy portfolio in an effort to make a positive impact on our clients’ results. Attribution answers the question, “are the investment decisions creating or reducing value?” Each quarter The Joseph Group’s Investment Strategy Team creates an attribution report for each of our objective-based strategies. The report gives us information such as, for example, “overweighting global stocks relative to the policy portfolio by 5% added +0.47% in additional return over the policy portfolio.” In other words, the “policy portfolio attribution” gives us specific information to evaluate the efficacy of investment decisions and make course corrections if necessary.
We have the privilege of managing objective-based portfolios for clients and those portfolios are specifically designed to serve as tools to achieve the goals in our clients’ financial plans. The three levels of benchmarking we employ to evaluate portfolios are essential to making sure we have a consistent link between portfolios and planning so we can help our clients live out their purpose and have their lives reflect an incredible story.
Note: There is no guarantee that portfolio objectives, return targets, or volatility targets will be met in any The Joseph Group portfolio.

Written by Travis Upton, Partner, CEO and Chief Investment Officer