Is Foreign Stock Leadership Priced to Continue?
January 19, 2018
To Inform: In 2017, foreign stocks broadly outperformed U.S. stocks. Is foreign stock leadership a one-year fluke or can it continue? Part of the outperformance in 2017 came from a weaker dollar, but based on earnings and valuation, we believe both emerging market stocks (think India, Brazil, and China) and developed market foreign stocks (think Japan and European countries) have the potential to continue their outperformance.
We get into some nitty gritty detail in the discussion of the chart below, but for those who just want to skip to the conclusion, earnings growth is faster for foreign stocks than U.S. stocks and as a result, valuations for foreign stocks are getting relatively cheaper despite their strong performance.
The chart below has gotten a lot of discussion from The Joseph Group’s Investment Committee in recent days. It’s busy, but the key to the chart is the difference between the blue bar and the light gray bar for each region. The blue bar reflects company earnings for the region and the gray bar reflects the total return for 2017 for that region. Despite all regions having double-digit positive returns, where the light gray bar is LOWER than the blue bar, stocks in that region actually became cheaper in 2017.
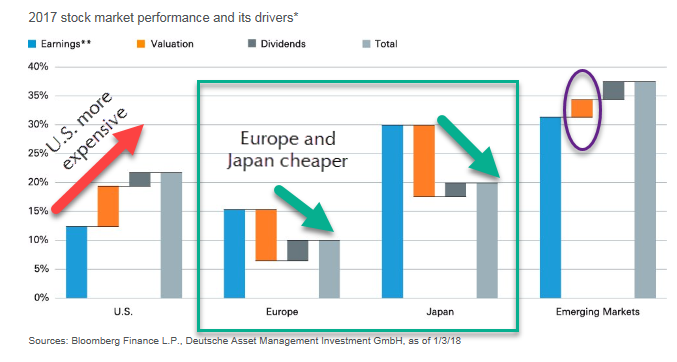
Source: Deutsche Asset Management
There is a lot going on in this chart, so let’s walk through how it works. In the U.S., stocks (as measured by the S&P 500) went up about 22% (see the light gray bar). The other bars for the U.S. break down the sources of those returns. Earnings (blue bar) accounted for about 12%, while dividends (dark gray) accounted for about 2% of the returns. The remaining 8% is represented by the orange bar and reflects an increase in valuation. Another way to think about this is in terms of the price to earnings (P/E) ratio. Even though the earnings, E, went up by about 12%, prices, P, went up more so the P/E ratio for U.S. stocks is higher at the beginning of 2018 than it was at the beginning of 2017.
Next, let’s look at Japan. Stocks in Japan went up by about 20% (gray bar), and dividends (dark gray) accounted for 2% of the return. Earnings for Japanese stocks though were up about 30%. With total returns being 20%, but earnings and dividends totaling 32%, the difference is the change in valuation, meaning Japanese stocks actually got 12% cheaper in 2017. In P/E terms, the E grew more than the P, so valuations, as measured by the P/E ratio, are cheaper for Japanese stocks at the beginning of 2018 than they were at the beginning of 2017.
In the case of emerging markets, which had the best overall returns (about 37%), the increase in valuation (orange bar) only contributed about 2% of the result. With emerging markets coming into 2017 trading at a 40% P/E discount to U.S. stocks, the valuation gap between U.S. and emerging market stocks only became wider.
A weaker dollar (which is not accounted for on this chart) provided the final tailwind for foreign stocks to broadly outperform U.S. stocks in 2017. We don’t know what will happen to the dollar in 2018, but if we look purely at fundamentals – earnings growth and valuation – it supports the idea that foreign stock outperformance may just be getting started.
Have a great week!