
It’s Midterm Election Season
September 11, 2026
To Inform:
This morning I called a good client and friend and as soon as he answered the phone, the conversation immediately went to politics. This weekend, I watched the Ohio State game with my 16-year-old son and as the commercials came on he said, “you can’t vote for that candidate” and then he proceeded to quote the negative things which were about to be said about that person. And as we are preparing for next Wednesday’s Portfolio and Pints event, I’ve been told there are a few questions in the hat from clients related to politics and markets.
Mid-term election season is here and how politics may impact markets is clearly on investors’ minds. While we won’t pretend to know what exactly what will happen, we do have lessons from history which can help us make educated decisions within portfolios. Let’s look at a few points about what history may tell us.
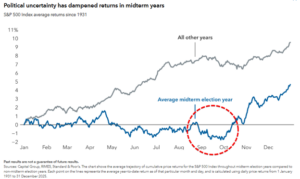
Midterm election years typically have lower returns, especially in the September to October period.
The chart below shows the typical annual returns pattern for the S&P 500 for most years (gray line) and then for the average mid-term election year (blue line). As you can see, the market historically tends to get choppy in the summer, and especially in the September to October period around the election.
It’s worth noting two things, however:
- Once the election is over, the market historically tends to rally in the last months of the year.
- The negative impact tends to be muted in years when the market is in an uptrend (like we are seeing this year).
Source: Capital Group
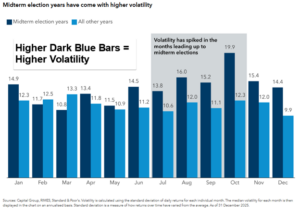
Volatility tends to spike in the months leading up to the midterm elections.
The chart below is relatively straight forward – the higher dark blue bars imply higher volatility, which in turn implies bigger swings in stock prices. Usually, those stock price swings are indicative of market weakness (but not always).
Source: Capital Group
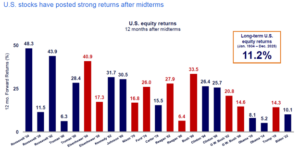
The 12 Months following a midterm election is usually positive for stocks.
I hope you’ve read this far, because here is the good news! The chart below shows returns for the S&P 500 12 months after a midterm election. If you look closely, you will notice whether the bars are blue (Democrat president) or red (Republican president), they are all going in one direction. That’s right, historically, the market has always had positive returns in the 12 months following a midterm election.
Source: Russell Investments
Frequent readers of WealthNotes know one of my favorite quotes is often attributed to Mark Twain, who said “history doesn’t repeat itself, but it often rhymes.” So, if history does rhyme, how should we think about markets in the months ahead? Three points:
- Maintain a big picture perspective. I know, investment people always say “think long-term” but historically, today’s volatility is minor compared with the historically positive returns 12 months following the midterms. We want to be thinking about future growth and playing offense.
- Think about dollar cost averaging new funds over the next few months. Dollar cost averaging is a fancy term for putting money into the market over time rather than dumping it in all at once. If the next couple of months are more volatile than usual, it could be a great opportunity to feed new money into the market and potentially add to stocks at lower prices.
- Come to Portfolios and Pints on September 16! If you have any unanswered questions, that is the place to ask them!

Written by Travis Upton, Partner and CEO