Looking for Leadership
February 22, 2016
Earlier this week, our Investment Strategy Team had a meeting and the focus was looking for “leadership” in the markets. We know markets are tough, but what areas are doing better than others? Here are three key observations:
1. “Value” stocks are outperforming “Growth” Stocks. So far in 2016, dividend paying and cyclical stocks are significantly outperforming growth stocks. This is a huge change from last year where “growth” stocks were dominant, led by the so-called “FANG” stocks (Facebook, Amazon, Netflix, and Google).
The chart below shows the relationship between “growth” and “value” investing has reached, the biggest extreme since the technology bubble in 1999/2000. Could the recent outperformance foreshadow a bigger change in the trend of growth and value investing? This is a question we are asking as we look at positioning client portfolios.
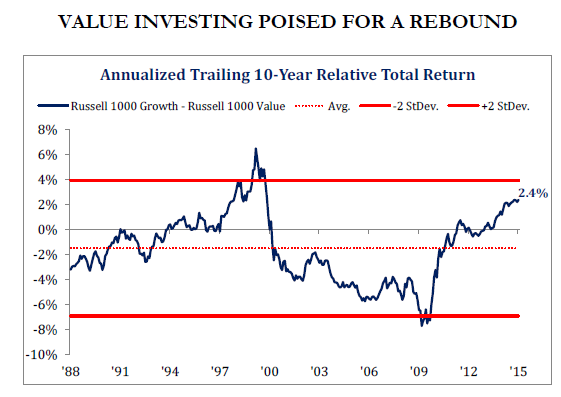
Source: Strategas Research Partners
2. Emerging Market Stocks are outperforming U.S. Stocks. In what may be a shocking statement, in the midst of a weak start to 2016, emerging market stocks in countries like India, Taiwan, Mexico, and in some cases, even China, are holding up better than U.S. stocks. We’re basing this statement looking at Morningstar categories – as of February 18th, Morningstar’s Diversified Emerging Markets category is outperforming Morningstar’s large blend category of U.S. stocks. The magnitude is not much, but we are also noticing that emerging market bonds are holding up well in the current market, which bolsters the case for emerging market leadership in general.
According to data from the Leuthold Group, the valuation (as measured by a normalized price/earnings ratio) of the MSCI Emerging Markets index is about half the valuation of the S&P 500. Could the recent outperformance be the start of a trend for cheaper emerging market stocks? Again, this is a question we are asking as we look at positioning client portfolios.
3. Credit, or “high yield bonds” is looking interesting. Clients in The Joseph Group’s allocation portfolios know that we have a slice of their pie chart allocated to a category we call “credit” which largely consists of high yield bonds. High yield bonds have not been immune to the rough start to the year (they are down, but down less than stocks), but this is an area that could be a good place for investors to “play offense” going forward.
Below is a snip from the Wall Street Journal’s online Market Data Center as of February 19, 2016. Check out highlighted numbers: 9.481% for the High Yield Constrained Index and 7.995% for the High Yield 100 Index. Those numbers are yields or interest rates – we are seeing high yield bonds pay in the neighborhood of 8% to 9.5%! Even if markets get worse, you can put together some pretty rough recessionary scenarios and still come up with a higher total return than the 1.77% rate on the 10-year Treasury bond.
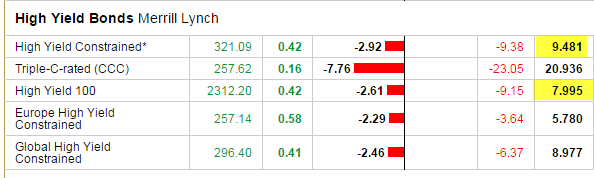
Source: Wall Street Market Data Center (Note: Constrained means no bond issuer composes more than 2% of the index, and High Yield 100 reflects the 100 largest high yield bonds.)
Earlier this week, one of the members of our investment team passed an analyst from a local large mutual fund company on the street. We asked him “how are you holding up in this rough market?” The analyst responded by saying “it’s markets like these where opportunities are created.” We’re certainly looking for those opportunities on behalf of our clients.