Lots of Investment Thoughts as We Start 2019
January 9, 2019
To Inform:
This WealthNotes “To Inform” piece is likely to run a little longer than normal as we take a look back at the sharp market correction that culminated 2 weeks ago, discuss what we are seeing in markets today, and share how we are positioning portfolios going forward.
Looking Back:
The Grinch certainly stole Christmas for investors as the S&P 500 declined approximately 12% during the nine trading days from December 13th to December 24th. Both the sharpness and magnitude of the decline were historic and unnerving – more than one person said: “we haven’t seen anything like this since 2008.” The catalyst for the decline was a whole soup of things – fears of a Fed “policy error” causing a recession, trade/tariff issues impacting the economy, and a government shutdown which is still ongoing. We will be the first to admit the decline was unnerving for us, too, but despite the market slicing through some of our technical thresholds on the downside, we did NOT advise clients to sell stocks. Why? There were three key things we were thinking:
1. The level of panic and emotion in the market was ENORMOUS. Below is a chart of one of our favorite investment sentiment indicators – the Smart Money/Dumb Money index. In general, the index tracks the behavior of more emotional individual investors (aka “Dumb Money) and more sophisticated institutional traders (aka “Smart Money”). When the red line and blue line are squiggling around each other like they were through most of 2018, there is not a lot of useless noise in the data, but when the blue and red lines move in opposite directions to an extreme, it can signal an excessive amount of fear or greed in the markets. On December 24th, which in hindsight has so far marked the bottom of the market decline (yellow highlight on the chart), the “Dumb Money” hit the largest extreme in the history of the index. In addition, multiple other sentiment indicators hit levels last seen at the bottom in March 2009. One reason clients hire us is to be logical when others are emotional and this was certainly a time where we needed to exercise logic and hold, if not buy, stocks.
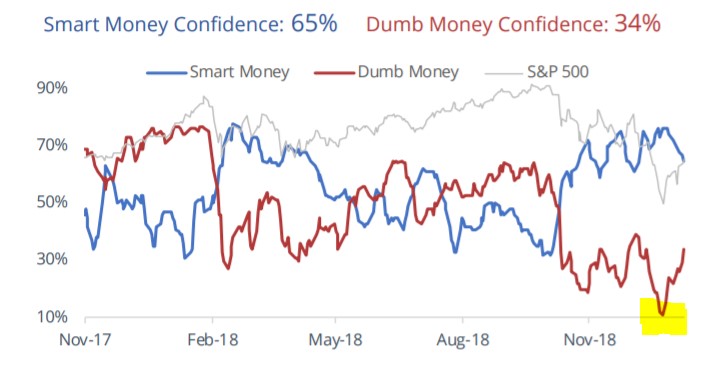 Source: Sentimentrader.com as of January 8, 2018
It also struck us that in the midst of the Christmas Eve decline, the worst performing sector in the S&P 500 that day was not something economically sensitive – like technology or banks. The worst performing sector was utilities. Utilities are typically thought of as “widow and orphan stocks” and tend to move more like bonds due to their steady dividends and government regulated contracts. The only way it made sense to us for utilities to lead in the decline was if a bunch of unsophisticated investors were calling their brokers and indiscriminately saying “sell everything.” It was hard at the time, but that kind of behavior is not something we are going to be a part of.
2. The economic data and credit environment were NOT in sync with the stock market decline. One of the key things we have been watching and are continuing to watch are credit spreads on high yield bonds. Think of “credit spreads” as the risk that a bunch of bonds are due to default as companies run into financial trouble or declare bankruptcy. The “spread” is the amount of interest over and above the government bond rate that investors earn as compensation for bearing default risk. On average, that “spread” has historically been about 4.5%. When the spread is lower than average, it means the financial system is generally healthy and investors are not worrying about companies defaulting on their bonds. When the number is higher than average, it is a sign of stress in the economy and the financial system. For historical context, the “spread” blew out to over 20% in 2008 and increased to over 8.5% during the last economic scare in early 2016. What did it do during the last two weeks? After hitting a multi-year low of 3.1% in early October, it definitely increased…but only to about 5.3% – slightly above average. Compared to the 2015/2016 economic scare, the stock market was saying things were worse and the bond market was saying things were better. In general, when the stock market and bond market are saying different things, the bond market is usually right.
3. The December stock market decline was focused in the U.S. – other areas globally were holding up better. When we look at 2018 as a whole, it was a rough year across the board. Of the major asset classes we track, only High-Quality Bonds were positive in 2018 (by +0.01%). U.S. large cap stocks were the best (least down) area of the global stock market for 2018 as a whole (largely due to a few technology stocks in the middle of the year) but they were among the worst for the 4th quarter of 2018. We noticed that while U.S. stocks were making new lows in December, Emerging Market stocks, which had gotten beaten up in the middle of the year, were holding (and continue to hold) their October lows. December seemed to be marking a change in global stock market leadership rather than a synchronized global decline (ala the Great Recession in 2008).
Looking Forward:
With clearer heads and the benefit of hindsight, Christmas Eve has so far marked the recent low for U.S. stocks. After six trading days in 2019, stocks and other asset classes have experienced a bounce with some of the largest decliners seeing some of the biggest recoveries. Looking forward, we believe there will be some economic fallout from the happenings of the last few weeks (we expect economic data to be weaker) but we also think a recession is avoidable if government and Fed policies shift. In early 2016, the economy was in worse shape than it is today with high-yield spreads showing significantly more signs of stress and oil prices about half of their current level ($26/barrel then compared to about $50/barrel now). In 2016, a shift in Fed policy to hold on rate increases coupled with fiscal stimulus allowed the economy and markets to recover. We will be watching, but we think a similar situation can happen today with the Fed already talking about slowing rate increases and fiscal stimulus coming more from overseas than the U.S.
Since “forecasts are for show and the allocations we make in portfolios are for dough” (thank you Steve Leuthold for that one), how are we thinking about our major assets classes as we enter 2019?
- High Quality Bonds – bias to underweight. We’ll just say it – bonds are frustrating. If the economy gets worse and moves closer to recession, High Quality Bonds will likely be one of the best tools to protect portfolios and investors will want more of them. However, if markets and the economy recover, interest rates will likely move higher, bonds will lose value and investors will wonder why they own bonds at all. With a starting 10-year Treasury yield of 2.70%, bonds are simply not priced to get investors to their return goals of 4%, 5%, or 6% a year. We view bonds as more of a risk controller than a return driver and plan to position them as such within portfolios.
- Credit (High Yield Bonds) – bias to underweight, but will increase exposure if the price is right. Literally, as I am typing this sentence, I just received a research alert saying “High Yield Bond Spreads Below 5.00%.” Credit is a tool we use to play offense in portfolios. Historically, when high yield spreads are above 5.00%, the risk/reward of high yield bonds is favorable compared to stocks and we want to be overweight. When spreads are below 5.00%, stocks tend to be the better offensive play. Today, the spread is 4.66%, about right in line with its historical average. With intermediate Treasury yields hovering around 2.5%, a spread of 4.66% means high yield bonds are paying (2.5% + 4.66% = ) around 7.2%, which is a very nice income cushion. We have not been overweight high yield bonds since 2016 when yields were closer to 10%. If spreads increase, we would not hesitate to shift dollars there again, but at current levels, we plan to hold our current slight underweight position.
- Global Stocks – bias to overweight. Our favorite areas within the global stocks market are large, high-quality dividend-paying stocks and emerging markets. As I type this, the market just opened for trading and stocks are bouncing across the board with emerging markets being the best performing number on my screen. We’ve been pounding the emerging market drum for a while and for some clients, when we mention it, we can see the revulsion on their faces. Emerging markets, tariffs, Asia – why in the world would you invest in emerging markets? Are you idiots? (Yes, those questions happened). Quietly, emerging market stocks (EM) have been assuming a leadership role among global indexes. While emerging markets have massively underperformed the S&P 500 over the last five years, after EM had a 30%+ jump in 2017, emerging markets and the S&P 500 have had similar performance for the last three years…just with a different path. Also, with EM continuing to maintain their October lows while the S&P broke to new lows in December, longer-term leadership charts between the U.S. and EM are starting to roll over in favor of EM. With lower valuations, higher earnings growth and the prospect of a lower dollar with the Fed pausing on rate increases, EM could have the trifecta for assuming global stock market leadership. By combining EM with attractively valued, dividend-focused U.S. stocks, we think investors still have a good long-term investment opportunity in the global stock market.
- Real Assets – bias to underweight, but respecting the recent bounce. Real assets have longer-term ties to inflation risk and include things like global real estate, infrastructure (think oil pipelines and toll roads) and commodities (like oil and gold). Future inflation expectations dropped dramatically in November/December, so there does not seem to be a large current need to protect against rising inflation. However, when we look at performance numbers in early 2019, Real Assets in aggregate are bouncing more than Global Stocks. We respect the current bounce but are considering trimming real asset exposure in the weeks ahead should valuations become less attractive.
This has not been an easy period for investors. Thank you for reading through a long WealthNotes as we try to share the myriad of thoughts coming out of our strategy meetings. Also, thank you for your trust and confidence as we navigate these crazy markets and seek to create portfolios that are effective tools to meet your goals and objectives.