Mid-Year Asset Class Observations
June 28, 2024
To Inform:
Today marks the close of the second quarter of 2024, and we are half-way through the calendar year. Let’s look at some broad observations for how 2024 is shaping up across asset classes.
High quality bonds are basically flat year-to-date (based on the Bloomberg Aggregate Bond Index). Heading into the year, expectations were high that the Fed may cut short-term rates as many as six times this year. Higher inflation numbers have meant the Fed has yet to cut rates, and only two rate cuts are now priced in between now and December. Longer-term interest rates have moved higher since the start of the year, and higher rates have meant a decline in bond prices which has effectively offset interest income earned on bonds leading to a flat total return.
High yield, or junk bonds are up about +2.5% year-to-date. Junk bonds pay interest over and above government bond rates to compensate investors for the risk of default. Currently the ICE B of A High Yield Index has an income yield of +7.6%.
The S&P 500, which is weighted by company size, is up about +15%, dominating most other asset classes. What is interesting, if we take all 500 companies and equally-weight them (+0.2% in each), the equally weighted S&P 500 index is up less than 5%, reflecting a lackluster broader market.
The chart below unpacks what is happening here. The red line in the upper panel represents the equally weighted S&P 500 vs the normal size weighted index. For about 20 years from 2000-2020, the equally weighted index dominated (red line rising), but over the last 18 months, that relationship has changed dramatically (red line falling meaning equal weight underperforms).
The bottom panel of the chart reflects why – concentration within the normal, size-weighted S&P 500 is at its highest level ever. The Top 5 stocks within the S&P 500 now make up 29% of the index and the Top 10 make up 37.5% of the index (primarily big technology stocks). This means when we look at the S&P 500, the other 490 stocks make up 62.5% of the index. Have we ever seen this before? No – the magnitude of such a small number of stocks making up such a large weight in the index is without precedent. We saw a small tick up in concentration in 2000 at the peak of the technology bubble, but today’s concentration numbers eclipse what we saw 24 years ago.
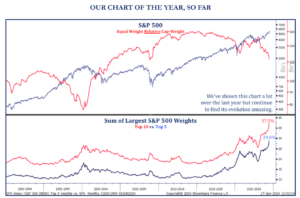
Source: Strategas Research Partners
Small company U.S. stocks (as measured by the Russell 2000 Index) are up about +1.2%. Again, we have an example of narrow leadership the first six months of the year within the U.S. stock market.
International stocks, as measured by the MSCI EAFE Index are up +5.7%. What we find interesting is a rising dollar has been a huge headwind and has subtracted about -7% from the index return. As U.S. investors, we only care about dollar returns, but the +12.7% return in local currency terms, without the big technology stocks we have here in the U.S., has us intrigued. If the dollar were to weaken in the second half of 2024, it could be a huge tailwind for foreign stock performance.
Real Assets have seen disparity in performance with commodities up about +6% YTD, Infrastructure (think utilities, cell towers, and oil pipelines) up about +4%, and global Real Estate Investment Trusts down – 4.5%. Within Real Assets, we closely follow gold and note gold’s +12.5% return for the first six months of 2024 outperforms all the broader Real Asset categories.
Putting it all together, investors in a diversified portfolio likely achieved moderate single-digit percentage returns for the first half of 2024. As we get into the seond half of the year, we think diversification remains important. It remains to be seen whether leadership in the next six months will come from the same places as it did the previous six months.
Note: Index data from Morningstar, year-to-date through June 27, 2024.

Written by Travis Upton, Partner and CEO