Optimistic About 2024
January 5, 2024
To Inform:
Last night we had a get together to celebrate my daughter’s 18th birthday. We were standing in the kitchen and my father-in-law asked me, “What do you think about the markets this year? If you look at the news you have some people who think it’s going to be a great year and others who think it’s going to be the worst ever! Why are the views so extreme?” I probably answered a little too quickly: “Political polarization – emotions are high in a presidential election year and the emotions are making everything seem extreme.” That said, we are approaching 2024 with optimism, especially regarding markets. Here are a few things we are thinking:
Optimism is the Best Default Position for Markets
I read an article last week from noted economic writer John Mauldin, and saw a quote I’ve seen many times before, but the timing of reading it again, this time from a big hedge fund manager, was perfect:
“The bear (pessimistic) case is always so compelling and sounds so intellectual, but it’s never helped me in my job of managing money because at the end of the day, the market tends to go up a lot more than it goes down.”
Mauldin in his letter goes on to elaborate. Paraphrasing Mauldin: “The data is clear – it pays to be optimistic. Optimists always have problems, pessimists always have problems, but research shows the best stance for your portfolio is cautious optimism. Investors should be thinking, this is where we are going, but we need to have risk controls. How I am I going to deal with risk?”
Question The Data
I want to elaborate on two points made here. First, I agree with the idea that often the bear (pessimistic) case is compelling and seems intellectual. However, it makes sense to question whether the data is really saying what it’s saying. I saw two charts recently which made me pause. I’ll give you the punchline first – the two charts ARE SHOWING IDENTICAL DATA.
Here’s Chart 1 showing U.S. business bankruptcies in the U.S. in 2023:

Source: Financial Times
Whoa, looking at this chart, bankruptcies are soaring! Batten down the hatches, this is awful!
Here’s Chart 2 showing U.S. business bankruptcies in the U.S. in 2023:
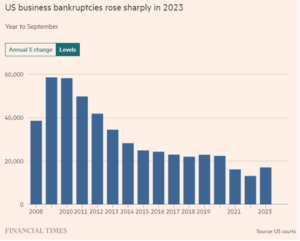
Source: Financial Times
Ok, if I look at this chart, bankruptcies in the U.S. in 2023 were higher than in 2022, but about where they were in in 2021, and well below the average in the past decade. Overall, things look healthy!
What’s the difference between the two charts? One shows the data in terms of percentage change while the other shows numeric levels. If someone wanted to scare the pants off their readers, they could use Chart 1, while if someone wanted to make readers feel calm and optimistic, they could show Chart 2. Bottom line – it’s the same data. The pessimistic case is compelling and likely evokes emotion which will engage readers (and that may be the agenda), but that doesn’t mean it’s helpful for investors.
Expect (and Prepare For) Speed Bumps
The second point I want to elaborate on is that pessimists and optimists will both have problems. Cautiously optimistic investors should know where they are going but have risk controls.
I love this chart from JPMorgan showing S&P 500 annual returns and annual top to bottom declines during the year.
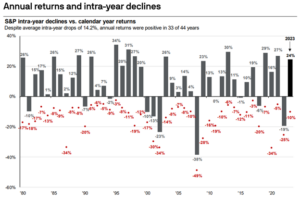
Source: JPMorgan Guide to the Markets as of 12/31/2023
With data going back to 1980, the S&P 500 had positive returns in 33 out of 44 years, but in each one of those years, stocks had an average top to bottom pullback averaging -14.2%. Optimism doesn’t mean expecting things will go up in a straight line. We believe optimism knows where we are heading while simultaneously preparing for speed bumps along the way.
Final Election Thoughts
Finally, one of the biggest questions on the minds of investors as we start 2024 is, “It’s a presidential election year, what will the market do?”
Here is a chart showing the average pattern for the S&P 500 for every presidential election year going back to 1960. The pattern is interesting – historically, the market chops around the first two months of the year, has a pullback around Super Tuesday in March, drifts higher over the summer, has some volatility around the actual election, and then moves higher once uncertainty is eliminated and a president is elected.

Source: Strategas Research Partners
Using my favorite Mark Twain quote, “history doesn’t necessarily repeat itself, but it often rhymes,” in looking at past patterns in presidential election years, the best default position is cautious optimism. Such a stance may seem difficult in such a polarized political climate, but ultimately, we believe the U.S. markets and the economy have more to do with the productivity of 330 million Americans who are working to make things better than the two candidates who are nominated to run for president.

Written by Travis Upton, Partner and Chief Executive Officer