Peak Inflation?
April 14, 2022
To Inform:
We get a lot of investment research emails each week and if there was a common theme the last few days, it was the phrase “peak inflation.”
Earlier this week inflation data came out for March. For the month, the consumer price index (CPI) surged +1.2% which equates to a whopping 8.5% on a year over year basis…that’s a big number. But, the “core” consumer price index, which excludes volatile food and energy prices rose a more moderate +0.3%, which equates to 6.5% year over year. That’s still high, but as frequent readers of WealthNotes know, we believe the markets tend to focus on “getting better or getting worse” rather than “good level or bad level.” As the chart below shows, the lower core CPI is a step in the right direction.
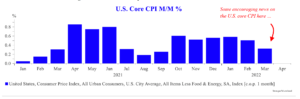
Source: Strategas Research Partners
Digging into the numbers, one of the reasons the core CPI came in lower was a drop in used car prices. As someone with a 16-year daughter (who happens to be taking her driver’s test later today) who says “Dad, I want a blue a Honda Fit” every evening at dinner, I’m personally excited about this fact. According to the Manheim Used Vehicle Value Index, used car prices have dropped -6% from January through March. Bigger picture, the drop in used car prices is reflective of supply bottlenecks clearing. Supply chains are improving and we’re starting to see it in prices. The chart below shows the price of shipping a 40-foot container from Shanghai to LA. It’s still high, but down noticeably in the past four weeks.
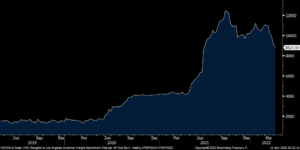
Source: Hamilton Lane, Bloomberg
Other data shows signs of improving as well. Crude oil peaked at $130 a barrel the first week in March (it’s $103 today) and gasoline peaked the week after (gas is below $4 in Central Ohio again). We’re also seeing signs that hourly wages have stopped accelerating. What may all of this mean for inflation? The chart below shows a forecast of the path inflation may take in the months ahead. Note the numbers on the chart are still positive. Expectations are not for “deflation” when we see prices falling in aggregate, but instead “disinflation” where prices are growing at a slower rate.
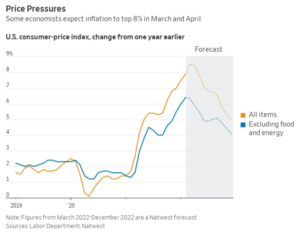
Source: Hamilton Lane, Wall Street Journal
What does all of this mean for consumers and markets? To use a hiking analogy, it’s like climbing up a hill but hitting a plateau of level ground. Going to the grocery store is still likely to result in a higher bill than a year ago, but it should stop getting worse. We also note stocks have bounced higher and interest rates have come down from multi-year highs in recent days. Again, the key is the market tends to look at “getting better or getting worse” rather than “good level or bad level.” If the economy (and the Fed) can engineer slowing inflation without a major contraction in growth, it would be the best possible scenario for financial markets.

Written by Travis Upton, Partner, CEO and Chief Investment Officer