Performance of the Few Outweighs the Performance of the Many
May 26, 2023
To Inform:
Every Friday The Joseph Group has what we call our ICAT meeting – Investment Communication and Advisor Team – and we spend the first 20-30 minutes talking about what is happening in the markets and performance across strategies. At today’s ICAT meeting, one topic was clearly front and center and it wasn’t the debt ceiling, it was the chart below:
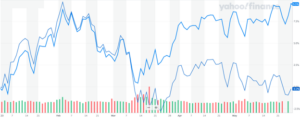
Source: Yahoo Finance
In the chart, the top line is the year-to-date performance (as of 5/25/23) of the S&P 500 index (+9.5%) and the bottom line is also…the YTD performance S&P 500 index (-0.2%). What?!?!? I’ll explain.
The S&P 500 index is a measure of the 500 largest companies in the U.S. and both lines measure the performance of the same 500 companies. The difference is the top line reflects the performance of the mainstream S&P 500 which is market capitalization weighted (a fancy way of saying size) while the bottom line is a measure of an equally weighted mix of the stocks in the index.
- In the market-cap weighted index (top line), the largest company (a well-known technology company) makes up 7.4% of the index while the smallest company (a less well-known cable/pay TV company) makes up 0.0047% of the index. NOTE: this is the most popular, most used version of the S&P 500 index.
- In the equally weighted version of the index, all 500 companies are weighted the same, or about 0.2% each.
Ok, now that we understand the difference, we can identify what is happening here: YTD (and it’s especially pronounced since mid-March) the largest companies in the index are dominating the performance of the overall index as a whole.
When we look at the largest companies in the market cap weighted index, we find many of them are technology related:
- Computer/phone maker: 7.40% weighting
- Software company: 6.97% weighting
- Internet company: 4.97% weighting
- eCommerce company: 2.95% weighting
- Computer chip maker: 2.68% weighting
Totaling up the weights of the top 5 companies in the market cap weighted S&P 500, the largest companies make up about 25% of the index while the other 495 make up the other 75%.
Now that we know the facts of what is happening, what can we learn from it? Here are some observations and takeaways:
- Market leadership can be described as narrow. TJG Client Advisor and Team Leader Jeff Tudor sent me the chart below showing through early this week, only 29% of the stocks in the S&P 500 are outperforming the index as a whole. We haven’t seen leadership this narrow since 1998-1999.
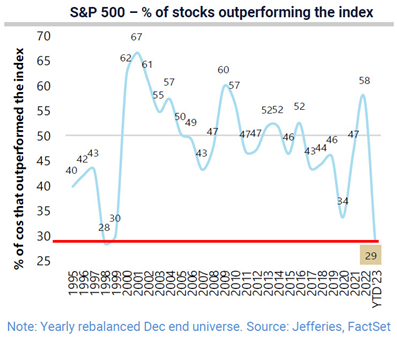
Source: Jefferies, FactSet
- Technology stocks are dominating performance so far in 2023. The chart below takes another slice at where leadership is coming from. The top line focuses on seven of the largest technology stocks in the S&P 500, and collectively those stocks are up a whopping 44% through a day or two ago. The other remaining 483 companies are only up 1%. In other words, to make a subtle Star Trek reference, the performance of a few outweighs the performance of the many.
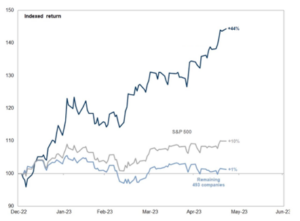
Source: Goldman Sachs
- Dividend paying stocks have been lagging so far this year. Here is another slice of the data (again, a few days old) which looks at the S&P 500 compared to an index of dividend paying stocks within the S&P 500. We note a big part of the discrepancy is banks, but as a whole, dividend paying companies have been laggards in recent months with negative YTD performance.
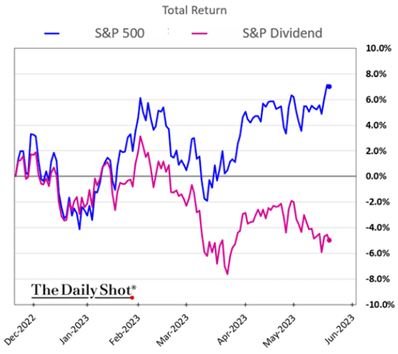
Source: The Daily Shot
- Leadership between equal-weight and market-cap weight has shifted over time. The table below shows the annual performance of the Market Cap and Equal Weight S&P 500 for each year going back to 1990. It’s a bit over a week old, but the performance gap between the weighting methodologies so far in 2023 is the 4th biggest on the page. That said, we find it noteworthy the equal-weight methodology has outperformed over more years.
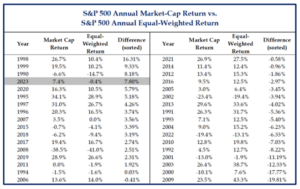
Source: Strategas Research Partners
What’s next for the market? It’s instructive to look at the table and see that even though the gap in performance between S&P weighting methodologies is extreme, it’s happened before – in both directions. At some point, market leadership will broaden and may even shift. Now the bigger question is…when?
We hope you have a blessed Memorial Day Weekend!

Written by Travis Upton, Partner, CEO and Chief Investment Officer