Portfolio Thoughts and Questions
March 6, 2020
To Inform:
After a week of 1000 point moves in the Dow in both directions, it’s strange seeing another down -700 points (as I’m typing this) but knowing the U.S. stock market is actually UP over 2% from where it was a week ago. We continue to pray for the people impacted by the coronavirus and with this morning’s news of schools closing in Seattle, we know lives are being impacted and fear is high. In this week’s Wealthnotes, we share some questions we have received from clients and are being discussed by our investment team.
Is The Joseph Group making any big changes in portfolios?
A number of clients have received trade confirmations from in the last week, but so far changes we have been making are small. Many of the trades we made this week involve taking profits in certain bond funds and shifting other parts of our bond allocation to ETFs in an effort to reduce expenses over the long term. We came into this market decline playing some defense and had increased that defense in certain portfolios at the end of January. We are pleased with our strategy returns relative to peer groups and how our purpose-based portfolios are holding up relative to their objectives. Having a solid foundation is allowing us the freedom to step back from the noise.
What are you hearing from outside investment research firms you work with?
A broad theme is “short-term pain but long-term gain” with most firms recommending overweights to stocks. News regarding the coronavirus is unfolding daily, but whether it takes weeks or months, once the virus is under control, strategists expect low interest rates and the massive stimulus being pumped into the economy to allow stocks to recover quickly. Last night, JP Morgan released a Global Asset Allocation update reaffirming a recommended overweight to stocks with a tilt toward European stocks and emerging markets.
We are also seeing numerous historical studies showing the history of market returns after times of high volatility. The chart below from Blackrock looks at times over the last 40 years when the U.S. stock market has had back-to-back days of being down -3% and what U.S. stock returns looked like one year later. While the data does not say anything about short-term volatility, history does support the conclusion that long-term investors looking to add stock exposure on the dips have been rewarded.
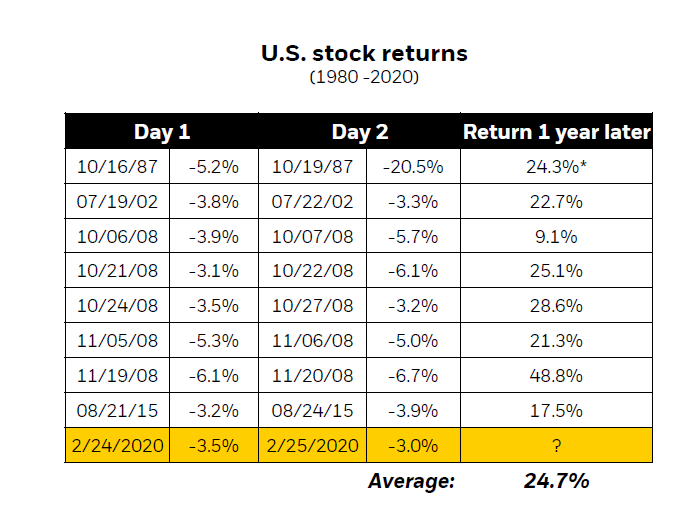
Source: Blackrock March 2020 Student of the Market, Morningstar Data as of 2/29/2020
What is The Joseph Group Investment Strategy Team focused on?
In our Investment Strategy Team meetings, we’ve been coming back to four key points:
- Oil prices – We would like to see oil prices stabilize around $50 which is a key level for many energy companies to have profitable projects. Today, the price for light sweet crude oil is $43 as I type this, after being above $60 in January. Oil prices were as low as $22 in early 2016, so markets have recovered from worse, but we would prefer to see more stability there.
- High yield bond and investment grade credit spreads – Spreads, the amount of interest above the government bond rate a corporate borrower pays, are a good indicator of broader stress in the financial and banking system. This morning Strategas Research Partners put out the chart below showing investment grade credit spreads. Think of the red line as “stress in the plumbing of the financial system” – as you can see, recent activity has been rather calm and not in the realm of the stress seen in 2008.
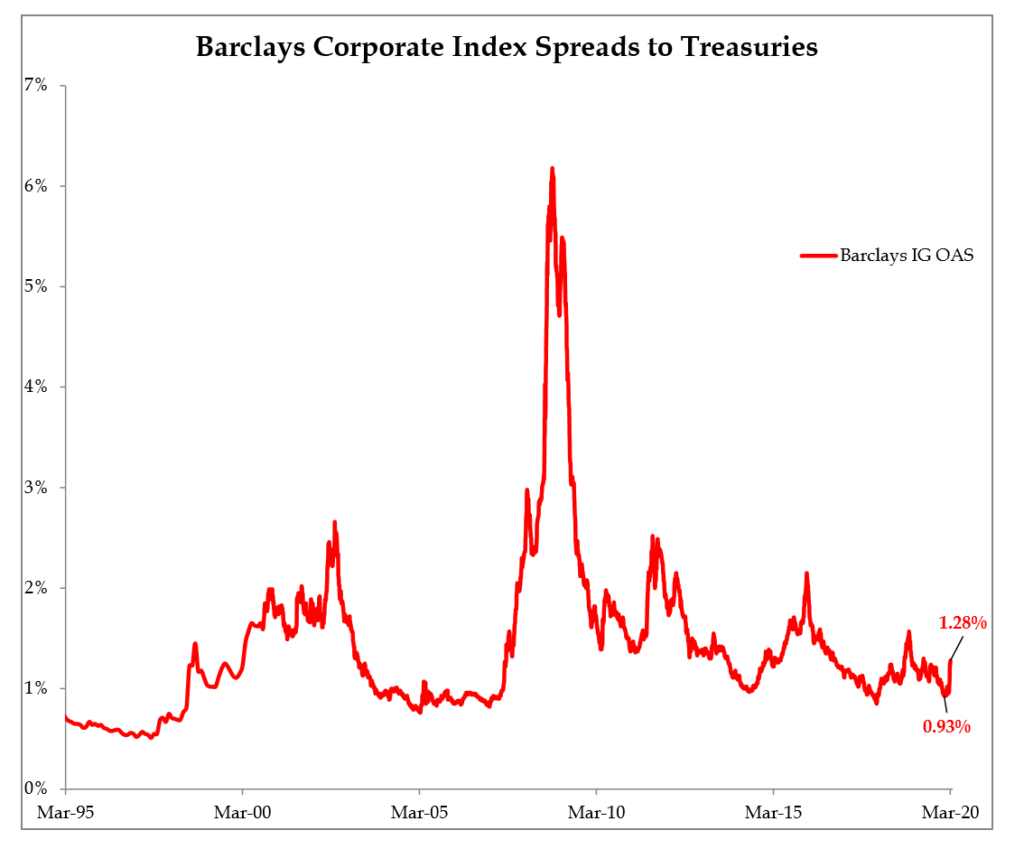
Source: Strategas Research Partners
- Level of short-term interest rates – The Federal Reserve made an emergency 0.50% interest rate cut this week, taking the upper bound of the Fed Funds rate from 1.75% to 1.25%. Despite the cut, the 2-year Treasury rate is sitting at 0.47% today (it was 1.58% on 12/31) which implies to us that the bond market is calling for 2-3 more rate cuts. We really would like to see the gap between the Fed Funds rate and the 2-year note stabilize before we get aggressive with adding more stock exposure within strategies.
- Investor sentiment – The difference in behavior between “Smart Money” institutional investors and “Dumb Money” more emotional individual investors can be fun to watch. The yellow highlight is my attempt to use the Snip and Sketch tool in Windows to show sentiment is still not showing the pessimistic extreme of Dumb Money selling (with Smart Money buying) it hit in December 2018 (only 15 months ago) but it’s getting closer.
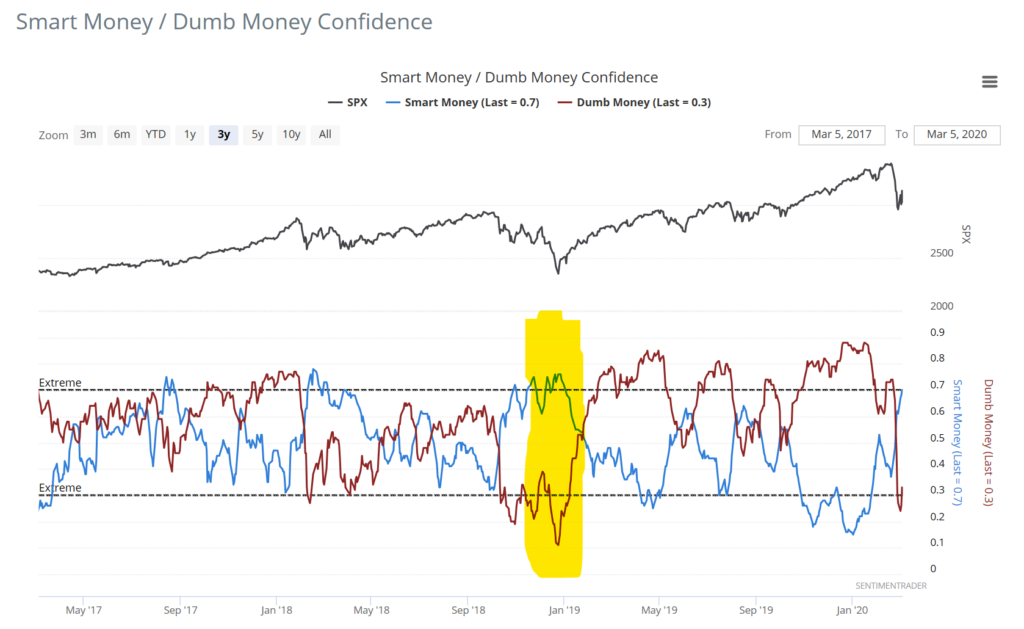
Source: Sentimentrader.com
In the time I’ve typed this, the Dow has improved by 300 points…maybe I should take my eyes off of the ticker more often. We will continue to keep you posted as to what we are thinking and doing in portfolios. During the last two weeks of volatility, having a solid foundation focused around purpose and objectives is calming in the midst of the market swings. We hope it is for our clients as well.