Stocks Can Get Cheaper as They Go Up
February 17, 2017
One of the biggest questions clients are asking right now is “Are stocks expensive?” And the short answer is yes – based on historical comparisons, valuations on U.S. stocks are definitely high. According to research from the Leuthold Group, as of 12/31/2016 the S&P 500 trailing price to earnings (P/E) ratio was in the 90th percentile (meaning stocks have only been more expensive 10% of the time) of valuations going back to 1920. Does that mean stock prices need to fall in order to get back to more reasonable valuations? Not necessarily….
It is very possible for stocks to get “cheaper” even if prices continue to go up. That’s an odd statement so let’s explain how it would work and what’s going on with stock valuations in today’s environment.
When analysts talk about “valuations” on stocks, the most common metric they use is the Price to Earnings, or P/E ratio. The P/E ratio simply looks at the price of a stock (or stock index) and divides that number by the earnings produced by that stock (or stock index) to come up with a ratio. For example, let’s take a look at the S&P 500 stock index. The S&P 500 is currently trading at a level of 2347 – that’s it’s price. The earnings produced by the 500 stocks within the S&P 500 in calendar year 2016 are about $118 per share (data from Strategas Research Partners). If we divide the price by the earnings, we come up with a P/E ratio for the S&P 500 of (2347 / $118) = 19.9. For reference, an “average” historical P/E ratio is around 16, hence the justification for stocks being “overvalued.”
Let’s dig a little deeper into the numbers. We know stock prices have gone up recently, so let’s focus on the bottom part of the equation – earnings. It may surprise investors to know that for the last three years, aggregate corporate earnings have been flat – there has been zero earnings growth for the S&P 500 since 2013. The chart below provides a picture of how things have played out. Each year, Wall Street analysts forecast earnings and they are virtually always too optimistic. In the chart, earnings for each year is represented by a squiggly line which declines over time. This happens because earnings estimates come down as expectations catch up to reality throughout the year. The bottom of each line reflects actual earnings. Since 2014, analysts have expected earnings to grow, but for the last three years’ earnings have been a disappointment. Big picture, the trend from year to year is up, but the dotted red line shows that aggregate earnings for the S&P 500 have remained flat at about $118 for the last three years. As prices have gone up but earnings have not, valuations have gotten more expensive.
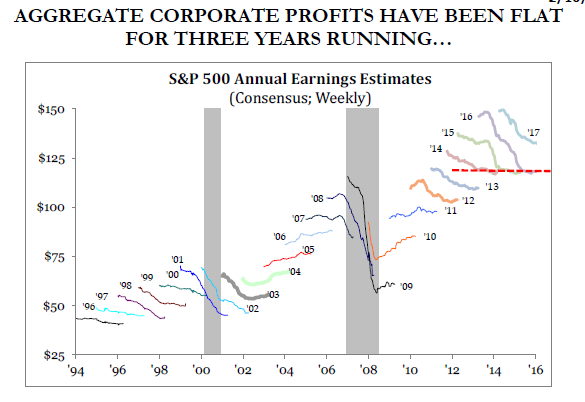
Source: Strategas Research Partners
Looking forward, it does appear the math is poised to change. Companies have reported earnings for the 4th quarter of 2016 and in aggregate earnings grew by about 8%, the strongest growth rate since 2014. Looking forward to 2017, optimism is high, but strong economic data, a recovery in the energy and financial sectors, and the prospect of tax reform and other fiscal stimulus is providing a positive backdrop for earnings. As the chart below shows, earnings are expected to come back in a big way in 2017.
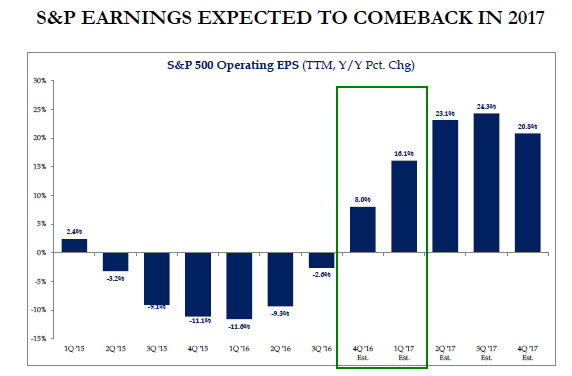
Source: Strategas Research Partners
Analysts are expecting overall S&P 500 earnings in 2017 to average $133 per share, which represents an approximate 13% growth rate over 2017. If we apply those earnings to today’s value for the S&P 500 of 2347, we come up with a P/E ratio of (2347 / $133) = 17.6, still on the high side, but much closer to the historical average.
The bottom line is that even though stocks are currently “overvalued,” prices do not necessarily have to fall and we do need to have a “bear market” to get back to more reasonable valuations. We could theoretically see mid-single digit returns for the S&P 500 (say 5-6%), but if earnings are growing at 10-11%, valuations would come down even as stock prices are going up.