Stocks Can Get Cheaper Even If Prices Keep Going Up
July 8, 2021
To Inform:
Despite spurts of volatility, major stock indexes have been bouncing around all-time highs in recent weeks. At the same time, measures of valuation show stocks have been getting cheaper. How is that possible?? Read on!
First some education and context. The most common measure of stock “valuations” looks at the ratio between “Price” (the level of the market index) and “Earnings” (the dollar amount of earnings produced by the market index). This ratio is known as the Price to Earnings, or P/E ratio.
Recently, corporate earnings have been depressed as a result of the pandemic, but stock prices have soared as the market looks forward to the recovery as the economy reopens. If we use round numbers, with the S&P 500 at a level of 4,000 and corporate earnings at a level of about $133 over the trailing 12 months, the Price to Earnings, or P/E ratio has been as high as (4300/140 = ) 30x. That’s a very high number compared to a historical average of 16.3!
As you can see in the chart below, in recent weeks, the P/E ratio has been coming down and based on trailing 12 months earnings, the ratio has gone from over 30x to 25.7x. That’s still expensive historically, but going in the right direction. The fun part is stocks have been getting cheaper as stock prices are going up!
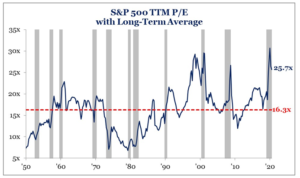
Source: Strategas Research Partners
Why is this happening? It’s simple – the denominator of the P/E ratio, earnings, has been growing even faster than stock prices.
Here are a couple of charts for perspective. First, the chart below looks at analyst estimates for S&P 500 earnings in 2022. Back in July, analysts were optimistic for 2022 – they thought earnings would recover from their 2020 levels of around $133 up to $185…not bad. However, as the recovery has progressed and earnings forecasts come in better than expected, the estimate for 2022 earnings has continually been revised upward and today is around $213.
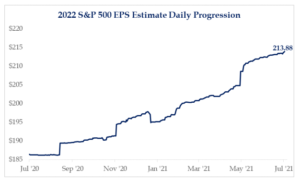
Source: Strategas Research Partners
Here is another picture of S&P 500 earnings per share going back to 1988, and it shows how earnings have soared in the recovery. According to Strategas Research Partners, S&P 500 earnings are expected to be up over 65% from a year ago. Wow!
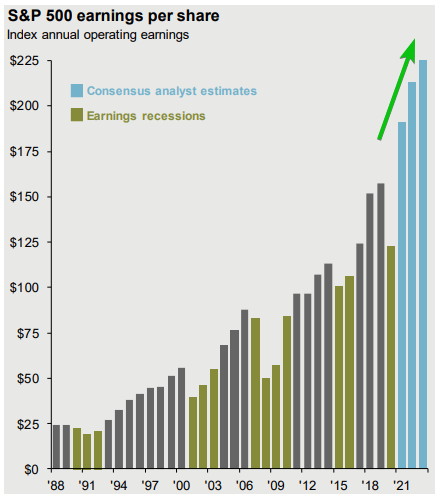
Source: Factset, JPMorgan Guide to the Markets
If we use today’s value for the S&P 500 of around 4,300 and divide it by earnings of $213, we come up with a forward P/E of (4,300 / $213 = ) 20.2x. That number is still on the expensive side, but MUCH cheaper than historical averages.
Here is one final chart to drive home the point. Even though the S&P 500 went up by 14.4% the first half of the year, earnings growth was even better at 19.7%. The difference between the two is the P/E multiple which contracted at -5.3% the first half of the year.
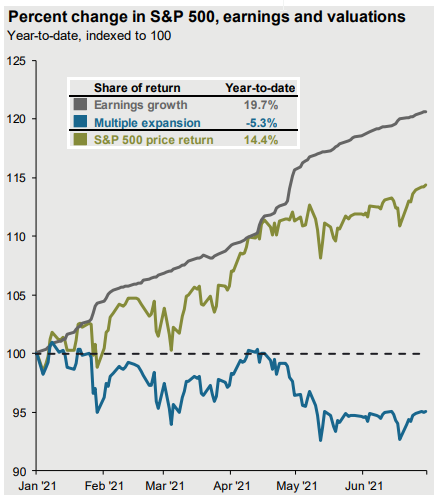
Source: Factset, JPMorgan Guide to the Markets
In other words, stocks are getting cheaper even as prices keep going up! When looking at valuations as a component of whether or not to invest in stocks, it’s important to focus on the journey and not just a point in time. Valuation metrics are definitely expensive, but with growing earnings, a few years from now stocks may look a lot cheaper even if prices don’t go down.

Written by Travis Upton, Partner, CEO and Chief Financial Officer