Taking a Few Market Vital Signs
October 4, 2019
To Inform:
To paraphrase the Wizard of Oz, “Impeachment, Iran drone strikes, Recession, oh my!” The financial markets have been dealing with a lot over the last few months. The 3rd quarter ended on Monday, and despite the swings, it was a positive quarter for many asset classes and most portfolios. However, as I’m writing on October 3rd, stocks have been weak the first two days of the 4th quarter. With all of the swings, how do we separate the signal from the noise? Clients of The Joseph Group know we look at a number of different “cross-market indicators” each month to try to look at the big picture. Much like a doctor will take a patient’s temperature and blood pressure, we try to take a few vital signs for the market. Here is what we are seeing with a few of them:
- 1. The “Trend” in U.S. Stocks Continues to be Strong. While we aren’t big market technicians (making investment decisions based on chart patterns), having a gauge on the market’s big-picture trend is important because the recessionary market decline most clients are concerned about tends to happen AFTER there is technical damage in the market. We took the chart below of the S&P 500 from Yahoo Finance. The purple line is the 50-day moving average and the red line is the 200-day moving average. With the 50-day trading above the 200-day average and both sloping up, technicians would say the market continues to be in an uptrend.
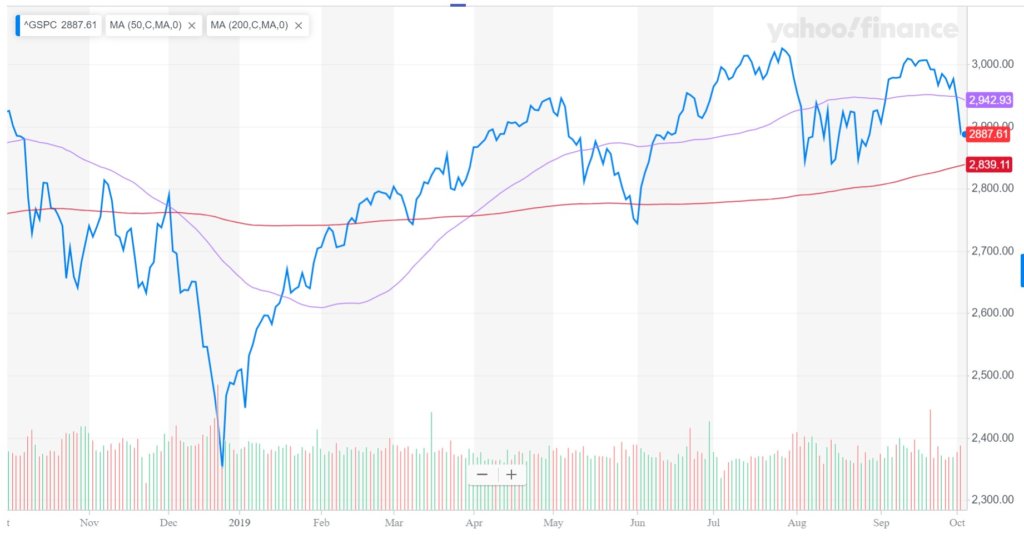 Source: Yahoo Finance
- 2. The Most Common Gauge of the Yield Curve is No Longer Inverted. Currently, the interest rate on the 10-year Treasury note is 1.58%. The interest rate on the 2-year Treasury note is 1.47%, so the difference between the two is a positive +0.11%. When the yield curve inverted in August (the rate on the 2-year note was higher than the rate on the 10-year note) it was clearly a red flag as an inverted yield curve has historically been a recessionary warning sign. In those past occurrences, once the yield curve inverts, it typically inverts further and will stay inverted for weeks or months. That’s not what has happened this time. We still consider the fact the yield curve did invert a “red flag” in our work, but we note the inversion has been short-lived compared to history. We also note bank stocks – both big banks and smaller regional banks – have actually outperformed the broader market over the last two months which is not the behavior you would expect if there were deep troubles in the financial system.
- 3. Credit spreads on junk bonds are contained. “Credit spreads” are the amount of interest over a risk-free rate to compensate lenders for lending money to risky companies. Currently this “credit spread” is 4.28% and over the last few months has ranged around 3.80% to 4.40%. At The Joseph Group, we look at levels higher than 5% as a potential red flag for credit conditions and the economy, and the numbers are not there yet. As a side note, we have received a few questions about the spike in “repo” (short-term funding) rates a couple of weeks ago, and contained credit along with the aforementioned relative strength in bank stocks is not consistent with repo rate trouble causing broader contagion.
So, is all of this to say the patient does not have health issues? No – weakness in manufacturing, the impact of tariffs, and all kinds of political activities are bound to cause volatility in the markets and we believe portfolios should be positioned for it. The vital signs are telling us that while the patient is working through their health issues, it’s not time to go to the emergency room.
Have a great week!