The Bang and the Whimper – Is the Market Trying to Form a Bottom?
April 11, 2018
To Inform:
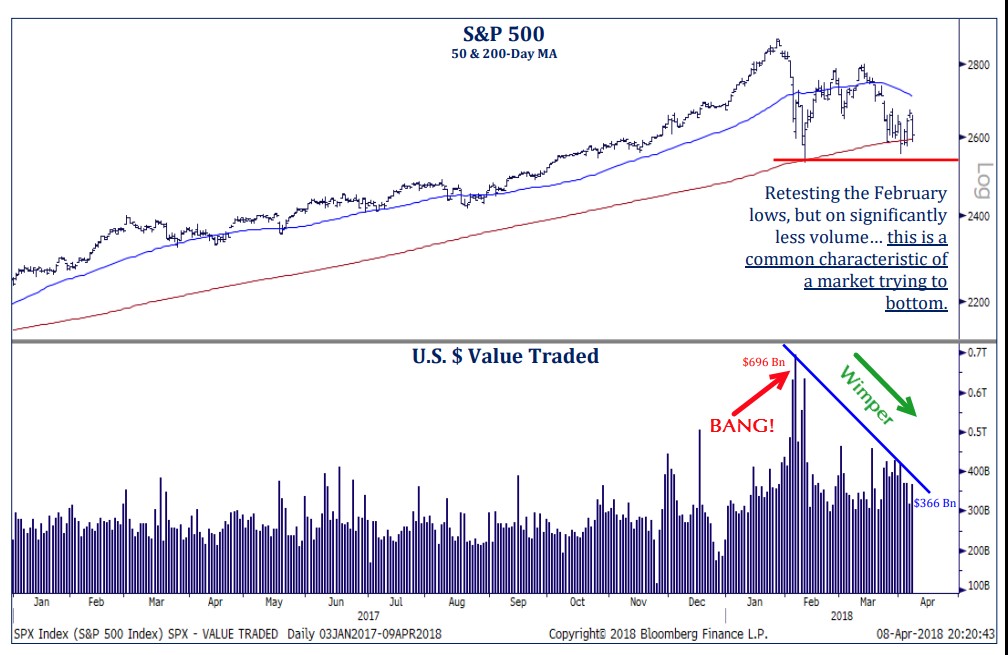
At The Joseph Group, we are not big market technicians who look for patterns in market charts, but we do want to be cognizant of investor behavior. Despite talk of trade wars, social media privacy, and Russia, on down days for stocks, the S&P 500 is bouncing around the same levels it hit two months ago. Some market prognosticators would call this “retesting the low.”
An interesting behavioral observation is that the market is “retesting the low” on lower volume. In February, as the US stock market had its first 10% correction since 2016, a lot of stock traded hands and the dollar value of stocks traded approached $700 billion (with a B). Two months later, the market is bouncing up and down, and on the down days, the index level has approached the lows of two months ago on much lower volume. The dollar value of stocks traded during last week’s lows is about $366 billion – only about half the dollar volume of a couple of months ago. The chart below shows what we are referring to with the price level of the S&P 500 on the top panel and the dollar volume of stocks traded on the bottom panel.
 Source: Strategas Research Partners
Market technicians have a term for markets where stocks retest the lows on lower volume – it’s referred to as “the bang and the whimper,” named after the closing lines of T.S. Eliot’s famous poem, The Hollow Men. Unlike Eliot’s poem, however, the whimper is not the end of the world – it is the end of the market correction. According to the thinking, markets may have a big event which causes a sharp correction and trading is heavy as people react emotionally to the news – the “bang.” Later, as the dust settles, the level of the market may retest the same levels, but it does so with less emotion and lower volume – “the whimper.” Market technicians would say the “whimper” is a more opportunistic time to add to stocks as emotions subside and the market refocuses on fundamentals.
Corrections are part of investing and we’ve been of the opinion that volatility would look more “normal” in 2018 after setting records for extremely low volatility in 2018. So far, that’s been the case. According to JP Morgan, over the last 38 years, the U.S. stock market has experienced an average top-to-bottom pullback each year of about 13.8%. By this comparison, the 10% correction we have seen this year is still below average, even though it is a much bigger correction than last year’s record-tying low 3% pullback.
We don’t know when the next tweet will create an emotional bang in the market but we do know our client’s portfolios and financial plans are built to account for market volatility. Markets may whimper, but our clients should not!