The Triple Lindy
February 3, 2023
To Inform:
The Rodney Dangerfield classic, Back to School, finds our protagonist Thornton Melon attempting the “Triple Lindy.” Mr. Melon attempts and completes a dive that anyone in the real world would be a fool to try. A person asks in the crowd what Mr. Melon is attempting. When told it’s the “Triple Lindy” she then asks if it is difficult. The answer? It’s impossible. Financial commentary, whether it be on television or in print, seems to think the odds that the economy achieve a “soft landing” is little better than Rodney Dangerfield navigating his death-defying stunt. We’ve shown the chart below before, but it’s worth sharing again. The consensus expectations for recession from professional forecasters has never been higher.
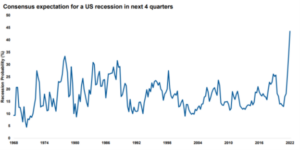
Source: Bloomberg
What then gives us hope that the US economy, and markets in turn, can avoid the fate so many are expecting? Let’s look at a few different clues the market is leaving for us, starting with market technicals. Take for example the concept of a “Golden Cross”. In simple terms, a Golden Cross happens when very recent (50 day) price performance has accelerated strongly relative to longer term price performance (200 day). There have been a number of these throughout market history and they are typically bullish. When they’ve occurred with stocks well below their all-time highs, the track record is even better. Occurring 16 times since 1950, markets have been higher over the next 12 months 15 out of 16 times. You can see performance over a range of intervals following these golden crosses in the table below.
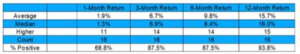
Source: Carson Research
Another clue we’ve found to be encouraging is the performance of “high beta” stocks relative to “low beta” stocks. High beta stocks are ones that typically move in much wider price ranges. High beta stocks are often the canary in the coal mine. They certainly were in 2022, lagging their low beta peers by a significant degree, seen in the downward sloping blue line on the chart below. This is typical in periods of market stress as higher beta stocks are typically lower quality and/or are more likely to be in cyclical market sectors (technology and consumer discretionary). The last great period of underperformance from these stocks occurred in the COVID crash of 2020.
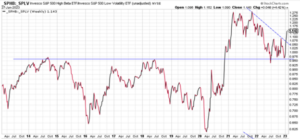
Source: Carson Research
Like clockwork, however, these stocks are the ones that tend to perform best coming off lows. While stocks attempted a rally in August of last year, performance from high beta stocks wasn’t as good as it has been recently. We take this as a good sign.
Lest you think we’ve turned solely to reading market tea leaves, we’re continuing to keep an eye on macroeconomic developments. Let’s start with today’s jobs number. Nonfarm payrolls increased by 517,000 in January (the consensus estimate leading up to today was 187,000), the strongest number since July of 2022, with unemployment falling to the lowest level since 1969. It is very hard to get negative on the US consumer, the driver of 2/3 of US GDP, when job creation continues at such a robust level.
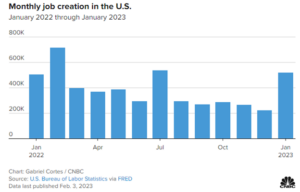
Source: CNBC
Pair strong employment numbers, falling inflation, and moderating wage growth with a Federal Reserve that is nearly done with their hiking campaign and you have a recipe for continued economic strength and market health.
The economy may well nail what many believe to be the impossible and avoid recession. Market technicals, jobs numbers, and inflation all appear to be headed in the right direction. With these things in mind it isn’t any wonder that the S&P 500 had had one of its strongest starts to a year in the last 30 years. We’ll continue looking at the clues the market leaves for us, along with the data that is released on a regular basis to be unbiased judges of the market landscape. But I think I speak for everyone when I say I’m rooting for the “Triple Lindy.”

Written by Alex Durbin, Portfolio Manager