The Yield Curve and Interest Rates
September 5, 2018
To Inform:
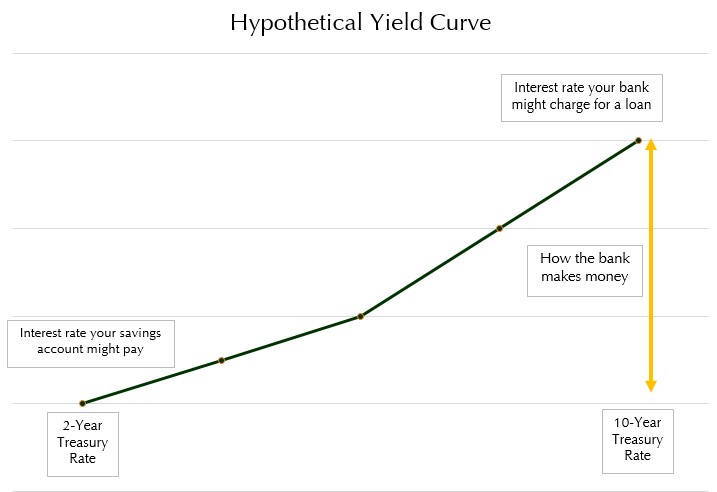
When you buy a bond, you are effectively loaning money out to a government or a corporation with the expectation to be repaid your original loan with interest. A bond repaying you in two years will often pay a different rate of interest than a bond repaying you in ten years. When we discuss the “yield curve”, we are simply referring to a line that connects the dots between 2, 5, 10, and 30-year bond interest rates. A yield curve can quickly display a visual relationship between different interest rates: in other words, are you being paid more interest by loaning money out for ten years rather than two?
Historically, the slope of the yield curve has been one of the most predictive indicators of future recessions. One of the ways to watch this measure is to look at the difference between the current interest rates on the 10-Year and 2-Year Treasury bonds. While it is not a perfect indicator, almost every time the 2-Year Treasury rate has been above the 10-year Treasury rate, a recession has followed.
Why does this happen? There are many different reasons, but let’s focus on how it might impact people like you and me.
 Source: TJG Global Investment Research
The yield curve a can be used as a loose representation of the banking system. Most banks lend money for longer periods of time – for example, a mortgage. At the same time, banks have to entice their customers with attractive interest rates on their money market and savings accounts. Banks make money by collecting the difference in interest collected from long-term loans paid out to customers.
While the relationship is not perfect, savings rates tend to be tied to short-term Treasury rates while loan rates tend to be tied to longer Treasury rates. If the long-term rates are lower than short-term rates, banks would receive lower interest payments than what they pay savings accounts and money markets. Due to the inability to turn a profit, banks would be less willing to lend.
How does this affect you and me? If banks are unwilling to make loans, a small business or entrepreneur might find it much more difficult to obtain the capital needed to start or improve their business. Imagine a manufacturing company that is no longer able to replace a broken machine or a startup that needs money to buy new equipment. When banks are unable to lend, economic growth has the potential to slow down or reverse.
At The Joseph Group, one of the Cross-Market Indicators we look at every month as part of our Market Health Analysis packet is the shape of the yield curve, and it is one we are monitoring closely. There is no such thing as a perfect indicator, but the yield curve has been a strong and accurate predictor of economic growth in the past. So far this year, the yield curve has been flattening for the past two years, with the difference between the 2-Year and 10-Year Treasury sitting around +0.20%. The flattening yield curve is a “yellow alert” in our analysis, but it will not turn into a “red alert” unless the 2-year rate moves above the 10-year rate and the yield curve inverts. We are staying tuned!