Tis the Seasonality
October 14, 2016
Yesterday a client asked, “Why was the market down today?” Our response was “Because it’s October.”
The response was not mean to be flippant – October is a month which is notorious for market volatility. The chart below looks at the “typical” seasonal pattern for the S&P 500 from September through December. (We need to put “typical” in quotes because the market is rarely typical). Historically, the September through mid-October period is one where the market moves sideways with some potentially volatile swings back and forth.
So far, 2016’s market action looks a lot like the historical pattern. On September 1st, the S&P 500 was at a level of 2173, while on October 14, the S&P 500 sits at a level of 2137. During this “soft” seasonal stretch the S&P 500 is down -1.6% with a number of big day to day swings – much like the chart below.
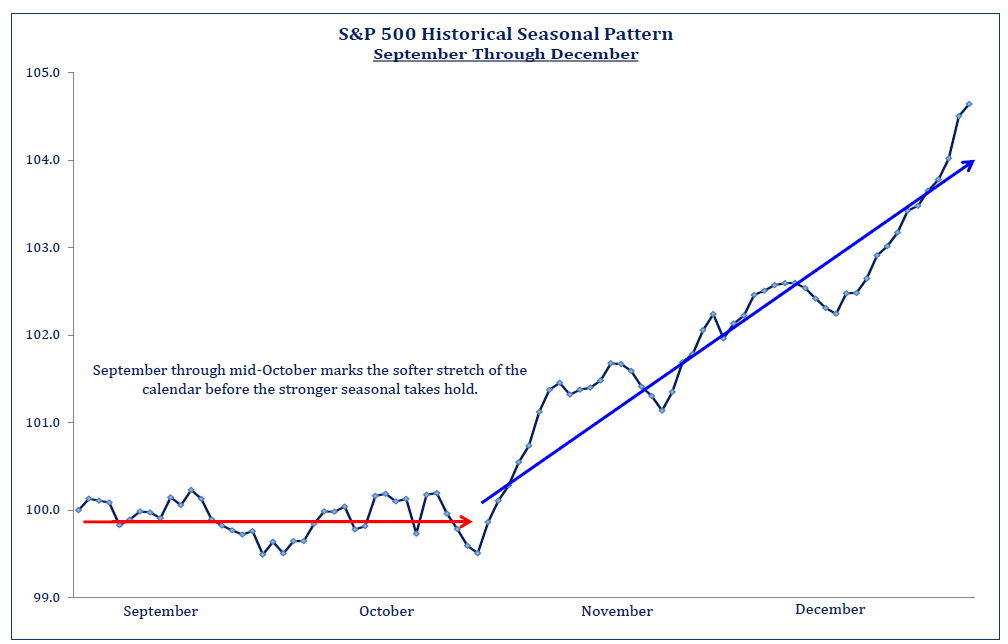
Source: Strategas Research Partners
So, the market is down the last six weeks but is there any good news? Absolutely! If you look past October, the “typical” seasonal pattern says Santa Claus is coming. The historical pattern is for the S&P 500 to start to rally in late October and remain strong into year end. In fact, in a number of years, the S&P 500 had made the majority of its gains in the last two months of the year.
You may be thinking, “OK, the historical pattern is for the market to bounce around in October and rally at the end of the year, but 2016 is anything but “typical.” Either Donald Trump or Hillary Clinton is going to be elected president in a few weeks – what might that do the market?”
Again, we put the word “typical” in quotes, but below is a chart showing the average performance of the S&P 500 in presidential election years. This year, (2016) is shown in red, while the dark blue reflects years when the incumbent party lost and the light blue reflects years when the incumbent party won.
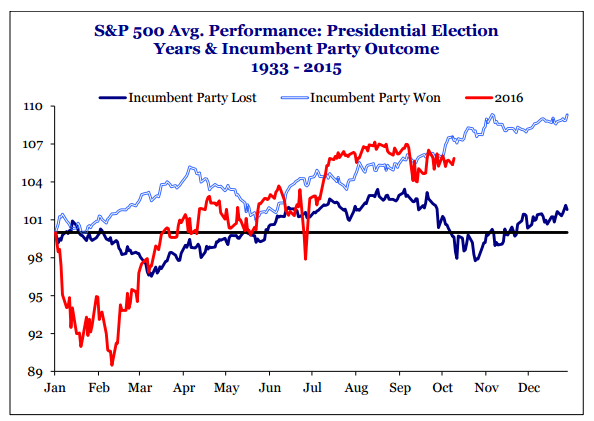
Source: Strategas Research Partners
We think two things can be gleaned from this chart:
First, no matter which side of the political aisle you are on, after a rough start to the year, the 2016 chart looks more like the chart where the incumbent party, in this case the Democrats, wins.
Second, the S&P 500 has a tendency to rally after the election regardless of the outcome. Markets hate uncertainty and simply knowing who is elected is historically enough to “trump” concerns over the policies of the winning candidate.