Understanding the Recent Market Correction
September 28, 2015
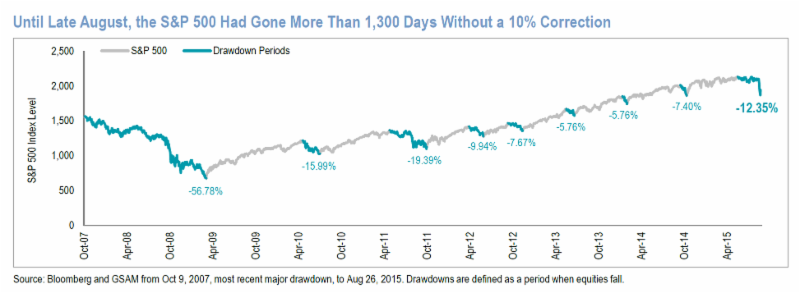
Fears of China’s slowing economy and the resulting correction it caused in late August has clearly rattled investors. The market registered its correction low on August 25th, and since then has had volatile swings both up and down, but over the last two weeks has bounced off of the lows enough to remain out of “correction” territory (down less than 10%). Understandably, investors are asking, “what’s next?” Here are some of the key things we are looking at:
1. What’s the difference between a “correction” and a “bear market?” A correction is technically defined as a fall of at least 10% from the previous high, while a “bear market” is usually associated with an extended downturn of 20% or more. Prior to August, the last “correction” occurred in 2011 where the market fell -19%. Historically, market corrections are relatively common, with a -10%+ intra-year decline typically happening at least once a year, however the close to four years between August, 2011 and August, 2015 represents the 3rd longest time in history between corrections.
Source: Goldman Sachs Asset Management
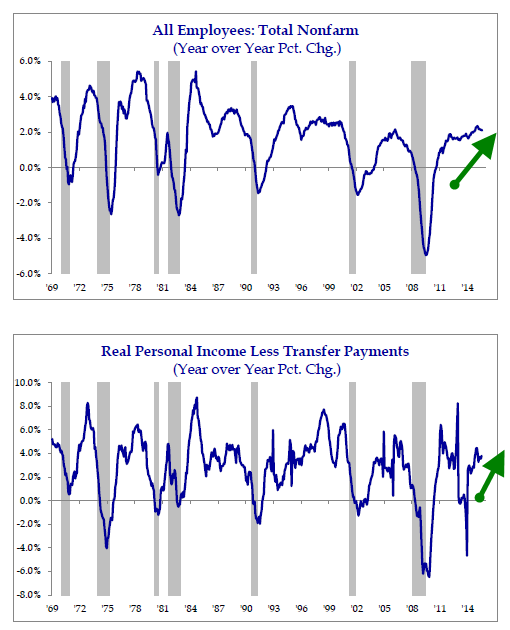
2. Is this a “correction” or the start of a “bear market?” Our investment committee has discussed this question a lot, and the bottom line is that sustained bear markets have typically been associated with recessions, and economic data is NOT pointing to a recession here in the U.S.
According to Strategas Research Partners, four key data series the National Bureau of Economic Research uses to indicate recessions are still broadly pointing to economic growth. As the charts below show, both employment and personal income are rising, and recessions generally do not occur when these area of the economy are so strong.
 Source: Strategas Research Partners
3. Does this most recent correction look like any other historical corrections to give investors a potential “road map” of what has happened historically?
In an email to clients, we indicated how similar the backdrop of the August decline was to the market decline in August, 1998. In that period, oil prices dropped, emerging market stocks were plunging, and there were severe problems in Asia. During that period, U.S. stocks dropped 18% before bottoming in October gaining 25% the final three months of the year to finish the year with a gain.
We are also struck by the chart of how closely the current market behavior resembles the correction in 2011. That year the market fell by over 19% from the peak before bottoming in late September and rallying at the end of the year.
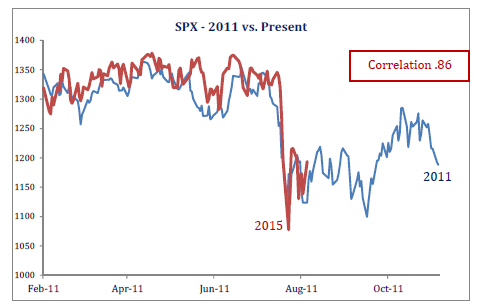 |
| Source: Strategas Research Partners |
When a market decline happens, no one rings a bell to say “this is the bottom!” but we are seeing some of the positive signs we want to be looking for. Corporate credit conditions have stabilized, and in the short-term, as the market bounces around, we are seeing a pattern of “higher lows.” We note that September is a negative seasonal period for the markets and there will be a great deal of attention paid to next week’s meeting of the Federal Reserve where the Fed will announce their decision of whether they are ready to raise interest rates. However, with the market stabilizing and indicators pointing to a recession in the U.S. being unlikely, we are looking to use further days of volatility as a chance to add stock exposure to client accounts.