Waiting on the Rest of the Market
December 6, 2024
To Inform:
As we near the end of 2024, it looks like this year will be like last in some respects. As in 2023, the US stock market has done well, but “the average stock” is underperforming the S&P 500. A way to measure the performance of the average stock is by looking at the performance of the equal-weight S&P 500 index. In this index, each stock has a 0.2% weight. Instead of the top 10 stocks accounting for around 1/3 of the index, here they account for just 2%. I wrote a few weeks ago about one of the fears facing investors, the fear of “missing out.” One way that fear has manifested itself is that investors are jettisoning small and mid-cap stocks from portfolios in favor of the largest stocks in the index.
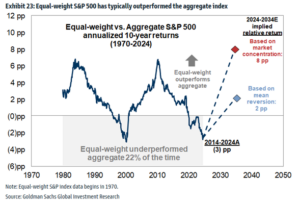
Goldman Sachs recently shared a paper where they charted the difference between the equal-weight S&P 500 index vs the size-weighted index. When the blue line is above 0, that means the average stock is outperforming. When it is below, the average stock is underperforming.

Source: Goldman Sachs
I recently read a paper by a renowned academic in finance. A jovial guy, he’d probably more readily accept the label of “egghead” but either way, his insights are helpful in times like these. In his paper he recommends investors “study, I mean really study history.” He then explains the difference between “statistical time” and “real-life time”. To illustrate what these terms mean, consider the chart above. An investor who rode the wave of outperforming average stocks in the 1980s would have seen relative returns slowly erode as the Tech Bubble took shape. Looking back, an investor studying this chart through a “statistical” lens would have perhaps said, “of course a trend can’t go in one direction, a thoughtful investor would have moved to the average stock in the late 1990s/2000.” But looking through the lens of “real-life time” would investors living through this period have had the same sense of rational wisdom? That is a hard question to answer, because we all experience things differently when living through it than when seeing it on a chart or reading about it in a book.
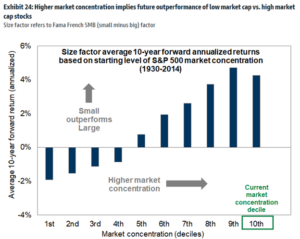
We’ve seen signs, albeit nascent, that this last decade’s trend could slowly be reversing. Since the beginning of July, the equal-weight S&P 500 has outperformed the size-weighted S&P 500 by about 1.5%. This level of outperformance is quite small, but the winds of change are nonetheless interesting when you consider history. Perhaps the biggest factor that will determine how the future unfolds is the level of market concentration today. While great companies dominate the top of the S&P 500, it is no secret that they comprise a very large portion of the index. Today the 10 largest stocks account for 35% of the S&P 500, the highest level in history since at least the late 1960s. In the same paper from Goldman Sachs I referenced above, researchers there looked at various market regimes going back to 1930 and found that periods in which the largest stocks account for a high percentage of the index, the next 10 years saw smaller companies outperform by an average of close to 4%.

Source: Goldman Sachs
So enough about the average stock. What does this mean for the portfolios of the average investor? Our belief is that it makes a good deal of sense to be positioned for an eventual reversal of the trend we’ve observed for the last 15 years. While the companies at the top of the S&P 500 are great companies generating lots of cash flow, we believe at some point gravity will assert itself. Trees don’t grow to the sky. A serious study of history leads us to believe that positioning the client portfolios that we have the privilege of managing is not a process that is to be ruled by the emotional fear of missing out. Rather, we believe a prudent allocation to small and mid-cap stocks, along with active stock picking fund managers is a way to prepare for a future that could see a return of the average stock.

Written by Alex Durbin, Chief Investment Officer