What History Says About Fund Flows Around Elections
October 30, 2020
To Inform:
Earlier this week we held our Portfolios at Your Place Event looking at the “Final Countdown” before next week’s presidential election. We covered a lot of ground including potential planning implications with proposed changes in tax policy, portfolio implications of a weaker dollar post-election (it favors foreign stocks), and a look at which sectors might provide market leadership given each candidate’s proposed policies. Although we also talked about the implications of a contested election, we hope to have clarity on some of these issues in less than a week. If you missed this week’s event, we will be talking about the Election Impact on Portfolios and Planning at a virtual event on November 19th at 4pm and we would love for you to join us.
One item which is interesting to look at regardless of who wins the election next week is the history of fund flows into stocks before and after presidential elections. Fund flows can often give insight into investor behavior.
The chart below looks at cumulative fund flows going into stocks one year before and after the last five presidential elections. As you can see with the blue line below, there is a distinct “V” pattern with fund flows decreasing ahead of an uncertain election result and then accelerating once the election has been decided and investors can start making decisions with more clarity, regardless of who wins.
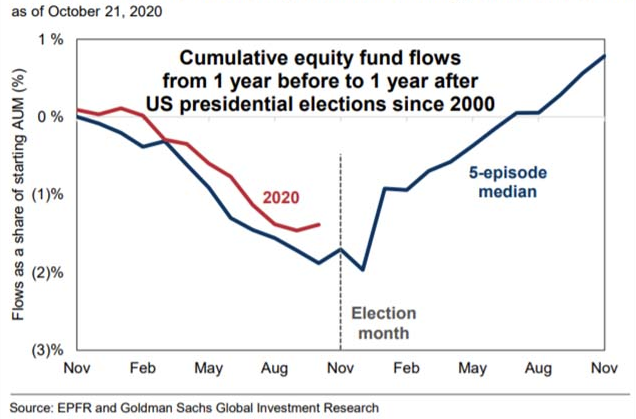
Source: Goldman Sachs Global Investment Research
As you can see from the red line in the chart, so far, 2020 is tracking pretty closely to the historical pattern. I think this is interesting because in the last 10 days or so, my own conversations with clients seem to be tracking right along with this chart. Rather than getting questions regarding concerns over the market going down because of the election, I am getting more questions from investors who have cash and want a plan for putting that cash to work after the election.
So, if investor psychology is shifting from pulling money out of stocks ahead of the election to putting money into stocks after the election, what are the implications for returns? American Century Investments took a look at returns before and after elections going back to 1927 and the “V-shaped” pattern looks pretty similar.
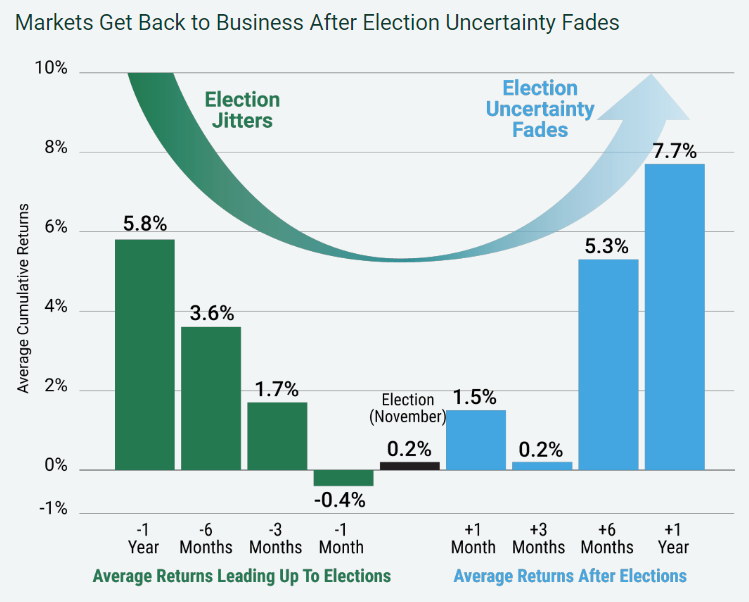
Source: American Century Investments
The pattern seems to suggest short term returns around the election are low given the huge amount of uncertainty, but as policies become clear, investors in turn have more clarity when making decisions and funds come back into the market. The result is that returns six months and a year after the election look even better than returns six months to a year before the election.
One of my favorite quotes is often attributed to Mark Twain – “history doesn’t repeat itself, but it often rhymes.” This presidential election is clearly different than any other in history, but there seems to be some rhyming when it comes to investor behavior.

This WealthNotes article was written by Travis Upton, Partner, CEO and Chief Investment Officer