When is Volatility Just Noise?
October 8, 2021
To Inform:
Earlier this week, I had a client ask if we could talk later in the day about the recent market volatility. When he sent his email that morning, the Dow was down -400 points… when we talked a few hours later, all of the market indexes were showing green and the Dow was up +100 points. I think he felt better even before our conversation!
Also this week, I was asked how the debt ceiling discussions were impacting our investment strategy. My response was simply, “it’s not.” In our opinion, the debt ceiling is one of many examples of noise – headlines which grab emotions but have no real long-term impact on the economy or corporate earnings. There can be a lot of noise in markets… let’s try to provide a little context.
The chart below shows how often the market moves by +/- 1% within a given month. On average, over 20% of the market’s daily moves are in excess of 1%, or about one day out of each Monday – Friday trading week. We also observe on the chart a bit of a summer lull and a seasonal pick up in volatility in October, which is pretty interesting.
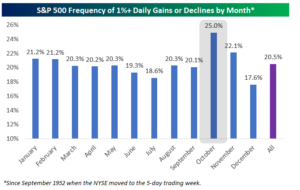
Source: BespokeInvest.com
Let’s put some numbers to this data. The closely-watched Dow Jones Industrial Average currently has a value of over 34,000. That means a 1% move would be over 340 points. As I type this paragraph, the headline on CNBC says “Dow rises 300 points as investors cheer short-term debt ceiling solution.” While we like the good news, today’s move doesn’t even register on the chart above.
You may be thinking, “that’s great, markets can have some big swings during a week and I get ignoring the noise, but it’s the downside I’m most concerned about.” Let’s try to provide a little historical context there as well.
The chart below shows bars representing the annual return of the S&P 500 along with red dots representing the biggest top to bottom decline during that calendar year. Since 1980, despite experiencing an average annual intra-year drop of -14.3%, the S&P registered positive annual returns in 31 out of 41 years. A conclusion here is that long-term investors should focus on the annual gains… for investors with a long-time horizon, the intra-year drops (red dots) often represent the year’s best buying opportunities.
It’s worth noting, so far in 2021, the 5% drop the S&P 500 has experienced (most of it in September) is pretty small in a historical context.
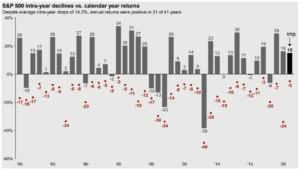
Source: JP Morgan Asset Management
So, is there any way we can use this information to our advantage as investors? Here are two things which are coming up frequently in investment conversations with clients.
First, knowing we are in an environment where volatility is likely swing both ways, for new dollars, we believe dollar cost averaging makes sense. Dollar cost averaging, or DCA, is simply a process for investing dollars over time rather than one lump sum. By investing over a period of several weeks or months, an investor may avoid being exactly right on timing, but more importantly, they avoid being exactly wrong. Sometimes it does make more sense simply to invest a lump sum, but in a more volatile environment (especially considering seasonality around monthly like October), a DCA approach for new dollars can help take some emotion out of investing.
Second, volatility can create buying opportunities. One of the tools we like to use in volatile times is investor sentiment. Quoting Warren Buffett, we want to try to “buy when investors are fearful and sell when investors are greedy.” Sentiment as a tool tends to be less effective at identifying market tops, but when the market dips, extremes in sentiment can help identify attractive buying opportunities. One of our favorite sentiment indicators is the Smart Money/Dumb Money index. When “smart money” commercial hedgers are behaving in a different way from “dumb money” more emotional investors, it can be indicative of signal rather than noise. Currently, after a long period of “dumb money” optimism (again, sentiment is less effective in uptrends), we are seeing “dumb money” investors (red line) become more cautious as the smart money (blue line) is looking for opportunities.
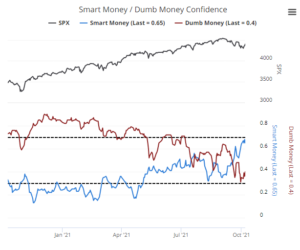
Source: Sentimentrader.com, Sundial Capital Research
Markets are often noisy, and seasonally, October has a history of being more volatile than normal. When we know these patterns in advance, it can be like putting on noise-cancelling headphones on an airplane – we can sit back, enjoy the ride, and focus on arriving at our destination.

Written by Travis Upton, Partner, CEO and Chief Investment Officer