Where is Market Leadership in the January Rally?
January 24, 2019
To Inform:
So far in 2019 the market for stocks and other risky assets has rallied and is beginning to recoup losses from late last year after ending 2018 with the worst December for the S&P 500 since 1931. In the Joseph Group’s Investment Strategy Team meetings, we often like to look below the surface and get a sense of what’s going on behind the numbers. In other words, where is the market leadership?
As we look at the numbers, here are some observations:
- The rally is broad-based with every major asset class posting gains. Sometimes market rallies can be narrow, being propelled by only a few stocks or sectors, and sometimes they can be broad with everything going up. In the chart below, several asset classes are shown with each of the asset class’ YTD rate of return represented by a different color. The market recovery in January has been BROAD with every major asset class including High-Quality Bonds, Credit (High Yield Bonds), U.S. Stocks, Foreign Stocks, and Real Assets posting positive returns, as the chart below illustrates.
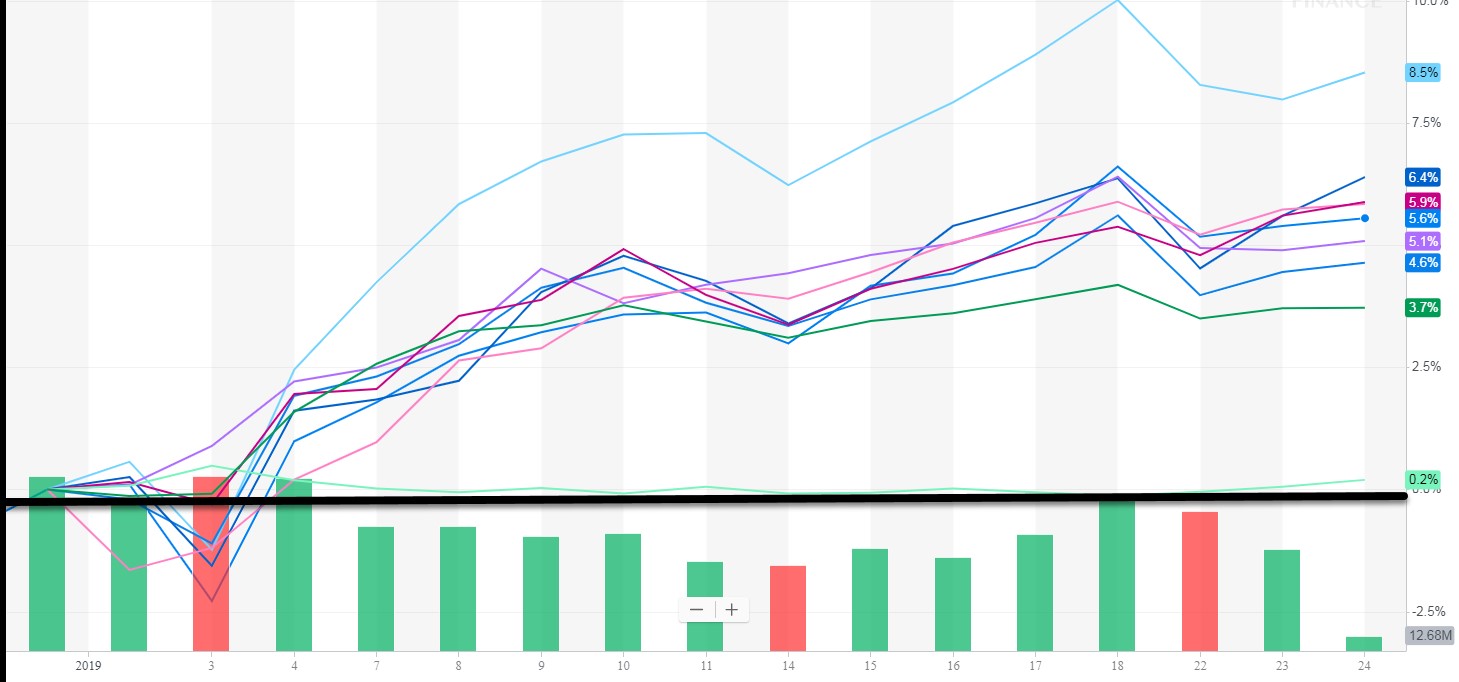 Source: Yahoo Finance – YTD Performance of Major Asset Classes through 1/24/2019
- Stocks over High-Quality Bonds. This one might be obvious, but even though every asset class has posted gains, the S&P 500 is up over 5% through January 23 and the Barcap Aggregate Bond Index is up only 0.20% (reflected in the light green line in the chart). Everything is positive, but riskier assets have dominated.
- Within Global Stocks, small caps have outperformed large caps. Across the board, whether we are looking at U.S. stocks or foreign stocks, the smaller the company, the better it has performed the first few weeks of 2019. Especially in the U.S., we think the recent small cap leadership is more of a “regression to the mean” rather than a true change in leadership. In the 4th quarter of last year, U.S. small caps were one of the worst performers with the Russell 2000 index of small cap stocks down -20.2% during the final three months of the year. In other words, what went down the most is bouncing the most. Looking forward, we are concerned small caps could again come under pressure if rolling back some of the corporate tax cuts becomes a topic in political negotiations. While we are pleased to see the small cap bounce (the highest line on the chart), we don’t plan to chase it.
- Emerging Market (EM) Stocks have performed as well as U.S. Stocks recently. This is one we are keeping a close eye on as a number of research firms we respect are suggesting emerging market stocks will lead the markets in the years to come. While Emerging Market stocks were one of the worst performing asset classes in 2018, their underperformance happened in the middle of the year and they were actually the best performing area of the global stock market (down the least) in the 4th quarter decline. Looking longer term, on a rolling three-year basis, returns for emerging market stocks are virtually identical to those of large U.S. stocks – they have just taken a different path to get there. From a technical perspective, some firms are saying their longer-term trend models are close to flipping in favor of EM leadership, much like they did in the early 2000s following the bursting of the technology bubble.
- Real Assets have kept up with Stocks. In the midst of the January rally, commodities, global real estate, and infrastructure (think oil pipelines, cell towers, and toll roads) have returns of 5%+, just like the S&P 500 and Emerging Markets. We think of Real Assets as having long term ties to inflation and these groups tend to be economically sensitive. Overall, we believe real assets performing well gives support to the view that the overall economy is still healthy.
- From a sector standpoint, energy has been dominant, while technology has been average. When we get even more granular and look at individual sectors, energy has been the clear market leader as markets have rallied this year (with financials being second). The surge in energy stocks is reflective of the bounce in oil prices. At the current price of $52.75/bbl for light sweet crude oil (as of January 24th), oil is up over 19% from its Christmas Eve low price of around $44/bbl. However, oil’s current price is still down 30% from its October 3rd level of $75.60/bbl.
While these observations may be more descriptive than prescriptive, the big picture being described seems much more positive than negative. Market sentiment is clearly fragile and sensitive to political, trade, and Fed headlines. However, a broad-based rally is much healthier than a narrowly focused rally and leadership coming from sectors like energy and financials is simply not consistent with a market that is teetering on the edge of recession.