Yield Curve Inversion – What’s Next for the Markets?
August 15, 2019
To Inform:
On Wednesday, for a brief period in the bond market, the interest rate on the 2-year Treasury note was higher than the interest rate on the 10-year Treasury note creating a rare bond market occurrence known as a “yield curve inversion.” (Note: yield curve is just a fancy name for a graph of interest rates over different time periods). Inversions, where short term interest rates are higher than longer-term interest rates, have happened five times in the last 40 years and are commonly thought of as signal for recession in the broader economy. Here are our thoughts on some important questions and the clues history might give us for what is ahead.
First, what’s going on in the bond market?
Interest rates have been heading lower both in the U.S. and across the world through most of this year and especially since May. Low inflation and a slowing global economy are thought of as the main culprits. As I (Travis) type this Wealthnote, the rate on the 2-year Treasury note is 1.52% and the rate on the 10-year note is 1.55%, for a difference of +0.03%. Right now, the curve is NOT inverted, but for a brief period yesterday, the 2-year rate was above the 10-year rate creating a difference (inversion) of -0.01%. It’s worth noting the 3-month Treasury rate has been higher than the 10-year rate at various times since March, but the relationship between the 2-year and the 10-year is the one most closely watched by economists, hence the media headlines and market reaction.
Does an inverted yield curve cause a recession?
No – we do not believe the relationship between the yield curve and the economy is one of cause and effect. We think a better analogy is a sick person with a fever. The fever is not causing the sickness, but it is a sign that something is not right and the patient is not healthy. We believe the “yield curve inversion” is analogous to a fever and is a sign not all is well in the U.S./global economy. If you are looking for causes, a “flu virus” and “trade war” may be a better analogy.
Historically, what happens after the yield curve has a small inversion like it did on Wednesday?
Looking at the five times in the last 40 years when there have been inversions, the inversions got bigger over the next several weeks/months. For example, after the 2-year and 10-year Treasury rates inverted on February 2, 2000, over the next 46 trading days, the gap between the two rates grew and on April 7, 2000, the 2-year rate was higher than the 10-year rate by more than a half percent (-0.52%).
Wow – the inversions got worse? Stocks must have been plunging!
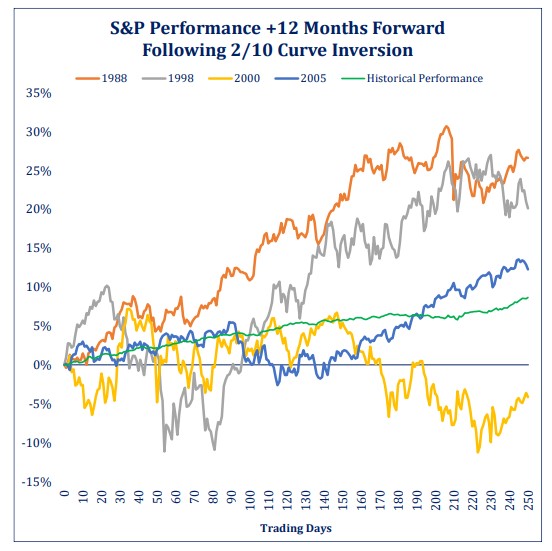
There is the challenge – in four of the five times we have seen the yield curve invert, as the inversion got wider, the S&P 500 went up! For a bigger picture perspective, below is a chart which looks at performance over the next 12 months following inversions. There was definitely volatility, but the trend was up still up. We do note the exception of 2000, where technology stocks had much higher valuations than they do today.
 Source: Strategas Research Partners
So, that’s helpful education – what’s next?
One of the many reasons clients hire The Joseph Group is to separate emotion from logic, and we’re supposed to be logical ones. We know the market is in an environment that is driven more by tweets than fundamental data right now and that’s creating big point swings both up and down. With that backdrop, here are three things we are doing:
- 1. We have created allocations to a short-term bond index fund (or equivalent) in a number of our allocation strategies with the thought that if investors are panicking, we want to be in the position to ask what we want to buy rather than panicking with them. We will use market strength as opportunities to grow those short-term bond allocations where it makes sense.
- 2. We are looking for leadership across asset classes and where leadership may be changing. For example, referring to the chart again, the yellow line was the lone instance where stocks went down after an inversion. In the midst of the subsequent 2000-2002 bear market for the S&P 500 (which was largely driven by technology), small cap value stocks, which had been laggards in the previous years, reversed and actually made money during the bear market. Rather than simply buying bonds at record low-interest rates, we think looking for leadership in other areas of the market is important.
- 3. We’re cognizant of our clients’ dream and goals. We construct our various investment strategies to serve as tools to accomplish a certain objective. As a result, the changes we make from one portfolio to another may be different because the objective we are trying to achieve is different. It’s important to clarify how investment decisions line up with our clients’ financial plans.
We welcome your questions and thoughts, especially when markets are volatile!