Are We in a New Bull Market? A Look at Both Sides
August 12, 2022
To Inform:
An up or down move of 20% is commonly used to define bull and bear markets. By that definition, the NASDAQ index, which is heavily weighted toward technology stocks, is in a new bull market. The NASDAQ index hit a low of approximately 10,646 on June 16 and traded at 12,854 on August 10…the quick math is a bounce of +20.7%. Now, for perspective, the NASDAQ is still down over -18% year to date (YTD), but at one point the YTD loss was well in excess of -30%…the bounce is certainly welcome to most investors.
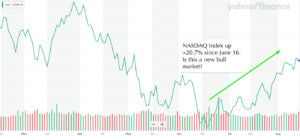
Source: Yahoo Finance
The $800 million-dollar question is of course, will the rally continue or is this rally just having a bear market bounce? Let’s look at some points on both sides.
The Bear Case
We’ve looked at A LOT of arguments for the current rally being simply a “head fake” or a “bear market bounce” and there are two key recurring themes – concerns about earnings and concerns about interest rates.
- The Fed is still planning to increase short term interest rates in the months ahead. After increasing the Fed Funds rate by +0.75% in July, the 2nd consecutive hike of that magnitude, the market is still pricing in the Fed to increase rates by at least +0.50% at its July meeting and another +0.25% in both its November and December meetings. Rate hikes impact the economy with a lag and there is concern further rate hikes could dramatically slow the economy and push us into a recession (which some believe we are in already).
- Earnings expectations may come down further. The bear case is rooted in the idea we have yet to see the proverbial “other shoe” drop with corporate earnings. So far, this year’s market decline has been entirely attributable to “multiple compression” which is a fancy way of saying P/E (or price to earnings) ratios have come down. The “E” or earnings has actually gone up this year but the “P” or the price paid for those earnings has had a sharp decline. Going back to math class with fractions, a rising denominator (earnings) with a falling numerator (stock prices) means the fraction is smaller (lower P/E ratio).
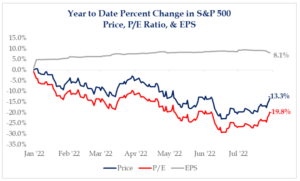
Source: Strategas Research Partners
The concern is as the economy slows, future earnings may come down sharply. If we see a decline in the E, the denominator of the P/E fraction, stocks start to look a whole lot more expensive. The chart below looks at projected earnings for the S&P 500 in 2023. Estimates are coming down, although so far the decline in projected earnings is about -2.5%, which we think is pretty small when contrasted with the magnitude of this year’s market decline. The dashed line at the bottom represents Strategas’ estimate of where earnings could fall…if they are right, the projected earnings decline would be a bit more than -7%. If earnings fall, it gets a lot harder to justify higher stock prices.
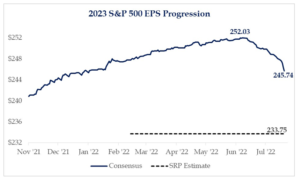
Source: Strategas Research Partners
The Bull Case
So we’ve looked at the bad news, what’s the good news? We believe there is actually quite a bit, but we will focus on two things we believe are influencing the recent rally – peak inflation and seasonality.
- It looks like the economy has hit peak inflation. On Wednesday of this week, markets popped when July’s Consumer Price Index (CPI) came in lower than expected. The rate of change for all sorts of items have come off of their highs. The charts below show stabilization for things like energy prices and air fares, and significant declines in the rate of change for things like used cars and rental cars.
Source: Bloomberg
And although prices at the grocery store remain stickily high, prices at the gas pump have come down and we are seeing a commensurate bump in consumer confidence. It’s still early, but signs of inflation coming under control are definitely good news for investors.
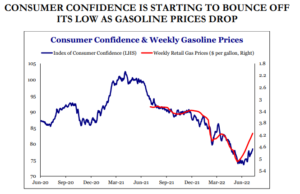
Source: Strategas Research Partners
- Seasonality/Mid Term Election Cycle favors higher stock prices in the months ahead. We’ve written a bunch about the historical tendency for markets to have a bigger than average corrections during mid-term election years (average pullback of -19% in mid-term election years since 1962) but then a bigger than average recovery 1 year later (average of +31.6%). We’ve clearly had the correction in this mid-term election year, will we get the bounce?
We remain struck by how this year has been similar to the mid-term election years of 1970 and 1982…the historical circumstances “rhyme” and both were years of sharp market declines, but also sharp recoveries in the final few months of the year.
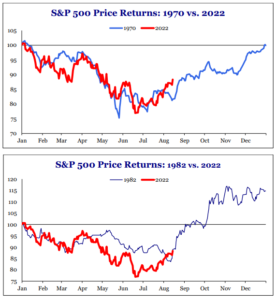
Source: Strategas Research Partners
We always want to evaluate market data in the context of client objectives. That said, as we look to position the objective based portfolios we have the privilege of managing for clients in the current environment, there are a few more bright spots than there were a couple of months ago.

Written by Travis Upton, Partner, CEO and Chief Investment Officer