Are We Seeing a 2nd Wave of the Virus, What is Different Today Than Three Months Ago, and What’s the Investment Playbook?
June 25, 2020
To Inform:
There is a lot going on so this will be a bit longer WealthNotes, but let’s break down these three questions.
Are We Seeing a 2nd Wave of the Virus?
The headline in today’s Wall Street Journal is clear – cases of COVID-19 are reaccelerating across various areas of the U.S. Part of the increase in cases is due to increased testing, but the percentage of positive tests also increasing. The chart below shows the national average of the percentage of COVID-19 tests coming back positive and that number has increased from about 4% two weeks ago to over 6% today.
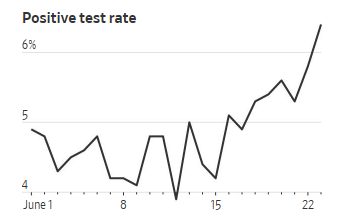
Source: Wall Street Journal
It may be semantics, but data we are seeing points to the increase in cases being a continuation of the first wave rolling across the U.S. rather than being a true 2nd wave, a sentiment echoed by White House expert Dr. Anthony Fauci. The increase in cases is most prominent in states such as Arizona, South Carolina, Florida, and Texas – all states which did not have major outbreaks a few months ago. Meanwhile, the previous “hot spots” for the virus, such as New York and New Jersey, are seeing cases, hospitalizations, and deaths continue to decline.
It is worth noting the increase in cases seems to be coming from younger individuals. The chart below shows the weekly median age of people who have tested positive for COVID-19 in Florida – in March, the median age was 65 while last week it was 35.
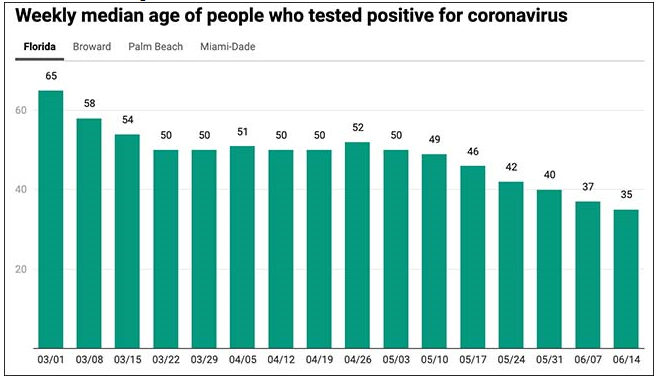
Source: 361 Capital
We specifically note the younger age of new cases because we believe it points to a lower likelihood of major lockdowns. In April, one of the major fears was hospital capacity being overrun and we are not seeing that today. Last week, Saum Sutaria, the COO of a major hospital system said in an interview, “We’re busy with COVID, but we’re not overwhelmed…patients in areas where cases are rising tend to be younger, in their mid-30’s to mid-60’s, and require less intensive care treatment.” (Source: CNBC.com.)
When it comes to the economy and markets, we believe the markets are more concerned about renewed lockdowns than the number of positive cases. We think it is important to monitor increases in the rate of hospitalizations and the number of deaths in order to get a sense of whether government officials may look to impose major lockdown again. So far, as shown in the chart below, even though the moving average around the number of cases is starting to increase, the number of deaths, which is accelerated about 10 days after cases in March, is not showing the same trend.
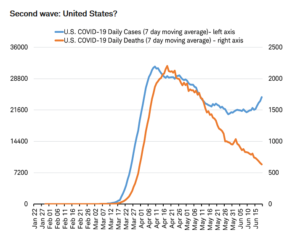
Source: Charles Schwab, Bloomberg as of 6/20/2020
What is Different Today Than Three Months Ago?
While acknowledging cases of the virus are increasing, we do think there are big differences between where the U.S. is today and where it was three months ago from the standpoint of innovation and economics. In our March 27 WealthNotes, we wrote the following:
“We cannot ignore the reality of the present situation nor can we ignore the reality of the human desire to move through it and make things better.”
Human ingenuity is incredible. In the last several months, we’ve seen massive innovations in technology designed to help us live with the virus. I read an article earlier this week where part of a major department store’s reopening was including ultraviolet handrail cleaners on its escalators. When the NBA resumes its basketball season in late July, players will have the option of wearing a smart-tech ring which is said to provide early detection of COVID-19 symptoms. The ring was initially developed as a sleep tracking device, but the West Virginia University Rockefeller Neuroscience Institute partnered with the developer to create a digital platform designed to find COVID-19 symptoms in advance. It is worth noting the company has donated thousands of these rings to frontline health care workers – it is not just NBA players who benefit.

Source: CBSNews.com
In addition to innovation, the monetary and fiscal support being given to the economy is massive. One of our “Anchoring Points” which we have discussed at our Portfolios at Your Place events is although the economic shock from the virus and shutdowns is historic, the monetary and fiscal stimulus measures are just as historic. The chart below shows the composition of the Federal Reserve balance sheet (the size is a measure of monetary stimulus). The recent increase is approaching $4 trillion dollars. To put that number in perspective, that’s about 10% of the size of the entire U.S. stock market. And that’s just the U.S. piece and just the monetary piece. We’ve been asked a number of times of why the stock market has bounced back in spite of economic data remaining challenging. We believe the answer is liquidity. We don’t want to downplay the economic problems caused around the virus, but we also cannot ignore the historic amount of support from the government and Central banks – with promises for more if needed.
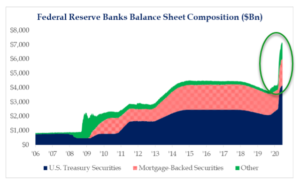
Source: Strategas Research Partners
What’s the Investment Playbook?
At our last Portfolios at Your Place event, we discussed our Investment Strategy Team’s big picture views across our five major asset categories (plus cash). Here are some key points related to that discussion:
- Cash: With the Fed keeping short term interest rates at zero, cash and money market funds are paying zero (or close to it). However, cash has “option value” in that if volatility picks up, cash allows for the purchase of things at lower prices. With so many things uncertain, we are currently are holding a bit more cash than usual across a few of our strategies for this reason, but have concrete plans for where we want to use it.
- High Quality Bonds: With the 10-year U.S. Treasury rate at 0.68%, it is tough to get excited about the return prospect for bonds. However, with the Fed committed to keeping short-term rates low through 2022, longer term bond rates have a bit of an anchor. We believe high quality bonds can outperform cash over the long haul and will still act as “insurance” if volatility picks up.
- Credit (High Yield Bonds): Rates on high yield bonds are down from their highs a couple of months ago, in large part due to Federal Reserve support where the Fed is buying ETFs and individual bonds. Currently, high yield bonds are paying interest of 6% over and above the government bond rate. If volatility increases – this is the most likely area we will deploy cash.
- Stocks: Two things we note are big technology stocks are continuing to act as “defense” in this market and that foreign stocks have started to outperform U.S. stocks. We think the latter point is especially noteworthy as multiple research sources we look at talk about the prospect of the dollar weakening, which would support foreign stock performance.
- Real Assets: Commodities, real estate, and infrastructure historically have had higher sensitivity to inflation. We note inflation expectations have picked up over the last six weeks, but are still at historically low levels. Real Assets are historically cheap, but there are other areas we are more excited about.
- Dynamic: This is a place in the portfolio where we try to have some things in the portfolio that can “zig when the market zags.” Currently, “optionality” is the key word for our positioning meaning we are holding strategies which participate in the upside if the market moves higher, but have a buffer which provides protection on the downside if markets move lower.
The bottom line – coronavirus cases in some areas are clearly increasing, but for multiple reasons, we do not believe the impact on the markets will play out like it did three months ago. Not only are there differences in where and how we are seeing cases, but technologically and economically, we are better equipped to deal with the virus impact. That said, we’ve built a bit of cushion across our objective-based strategies, recognizing the emotion and uncertainty which may lie ahead.