Charts Which Caught My Attention
September 6, 2024
To Inform:
This week our Chief Investment Officer, Alex Durbin, is putting together our updated Market Health Analysis (MHA) packet ahead of our Portfolios and Pints event the evening of September 12 at Hofbrauhaus. Alex and I will be pulling questions out of a hat, so we won’t know what is coming! That said, we want to be as prepared as possible. As Alex is working on the MHA, I’ve been sending him a few charts which have caught my attention.
Fed Rate Cuts – What About the Longer Term?
The financial media has been locked in on September 18, the date of the next Fed meeting, where the Fed is widely expected to cut short-term interest rates. According to the CME Fed Watch (as of September 6), the market is pricing in 77% odds the Fed will cut rates by 0.25% and 23% odds the Fed will cut by 0.50%. In other words, the market is essentially certain the Fed will cut rates in a week and a half, the question is by how much, with odds currently favoring one 0.25% cut.
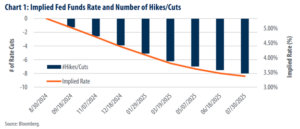
But what is likely to happen after September? The blue bars in the chart below show what is priced in for the next eight Fed meetings – a rate cut at each meeting, or eight in total. This implies the short-term interest rate which the Fed controls, which is currently at 5.50%, is priced in to decline to 3.50% by July of 2025!

Source: First Trust
Market pricing can change, especially looking out more than a year, but for now, the market is clearly viewing the likely rate cut a week from Wednesday to be the beginning of a longer series of cuts.
Valuations in Small Cap Stocks
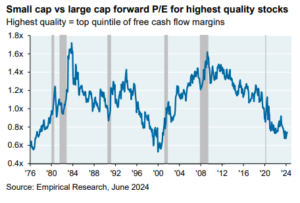
The second chart comes from the Chairman of Market and Investment Strategy for J.P. Morgan, Michael Cembalist. But it wasn’t just the chart, it was what Cembalist said which caught my attention:
“For diversified investors thinking about small cap stocks, today’s valuations offer the cheapest entry point in the 21st century.”
Wow – that’s a big statement. The chart below provides some perspective. Looking at high quality stocks, when the blue line is going up, small company stocks are expensive relative to large caps, and when the line is going down, small company stocks are cheaper. As you can see, the line is currently at the lowest point since 1999!

Source: JPMorgan
Right now, owning small company stocks is a challenge. Looking at indexes, the small company Russell 2000 stock index is up about 6% YTD through 9/6, but that trails larger company stocks which are up closer to 16% through the same period.
That said, I remember managing money as an Investment Officer in a bank trust department in the early 2000s. Large company stocks significantly outperformed in the late 1990s leading up to the technology bubble, but in the early 2000s, owning small cap stocks was a key to portfolio success. With relative valuations showing similar extremes to 25 years ago, is a similar reversal in leadership ahead?
Where Is Tax Policy Headed?
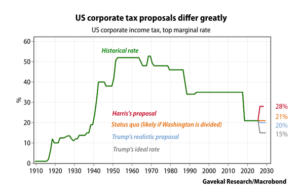
Here is the last one – there is a Presidential election coming up in November and the different candidates have different thoughts on what tax policy should be. Below is a summary of long-term history alongside “proposals” of where corporate taxes could end up under different candidates. There is a lot of “what if” here.

Source: Bloomberg
Alex and I will be talking about these points and many more at our Portfolios and Pints event next Thursday, September 12 (register here). We would love to see you there! Please bring a friend and add your questions to the German hat!

Written by Travis Upton, Partner and CEO