Corrections, Viruses, and Three Things We Are Focused On
February 28, 2020
To Inform:
As we said in a separate client update, what a difference a week makes. The S&P 500 hit an all-time record high on February 19. A week ago, leading economic indicators were hitting new highs and a large percentage of corporate earnings reports were exceeding expectations. Then the Coronavirus news hit… in the last week the Dow has experienced historic point declines and the S&P 500 is off about -14% since last Wednesday.
As we manage our various diversified strategies, we always need to be prepared for market corrections. A correction, technically defined as a 10% decline from a high point, happens on average at least once per year. Although the focus has shifted away from the election and toward the Coronavirus outbreak, the chart below looks at corrections during election years going back to 1948. The chart shows the average correction during an election year is roughly 10%.
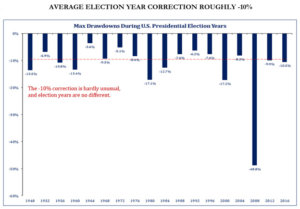
Source: Strategas Research Partners
A CNBC report on corrections published on February 27 was more specific. According to the article, there have been 26 market corrections since WWII with an average decline of 13.7%, and once the correction occurred, it took the market on average four months to recover. In other words, for longer-term investors, corrections tend to present buying opportunities.
So, those are great facts, but what about corrections that turn into something worse? After all, the election year chart sure had something bigger than average happen in 2008 when we had the housing crisis!
The CNBC article goes on to state there have been 12 bear markets (defined as a 20% or greater decline) since WWII with an average decline of 32.5%. On average, bear markets have lasted 14.5 months and have taken two years to recover. On an intraday basis, the most recent bear market occurred in December 2018.
You may be asking, so how do we know whether the recent decline is a correction or a bear market? Unfortunately, we only know for sure with the benefit of hindsight, and I don’t think anyone has a good handle right now on the spread of the Coronavirus. That said, there are three key areas we are focusing on to guide us for looking at whether we want to play offense or defense as it relates to the stock market:
- Oil prices – caution flag. Many energy companies use $50 as target number for the price of oil and determining whether a project is profitable or unprofitable. As a result, we do not want to see oil prices go below $50 for very long as that would have a real financial impact. Oil prices started the year around $63 in January, but have declined to around $45 today. Oil was $51.50 on Monday, so the below $50 target has not happened for long, but it is a red flag in our work.
- Interest rates – caution flag – rate cuts coming? The interest rate on the 10-year government bond remains above the rate on the 2-year government bond, so the yield curve is not inverted, but rates have dropped significantly in the last week. The rate decline means bonds (which rise in price as rates go down) have helped hedge stock market risk. It also points to an increasing likelihood the Fed will cut interest rates in March, if not before. We believe the market will respond favorably to a Fed rate cut, but the impact is unlikely to be as positive as news of containing the Coronavirus would be.
- Credit spreads – reflecting less stress in markets than stocks. The amount of interest over and above the government rate a risky borrower pays is known as a credit spread and can be a good signal for stress in the banking and credit system. Internally, we use 5% as a key level, and as of Thursday’s close the level was 4.62%.
The chart below looks at investment grade credit spreads (not junk) but it provides a good picture for why we look at credit spreads as a sign of market stress. Take a look at the blue line. In 2008, spreads started to rise before the market correction got worse. Today, investment grade spreads are elevated, but within the same range they have been for the last year. We’ll be monitoring the numbers but the current level supports the case that credit markets and the banking system are panicking much less than the stock market.
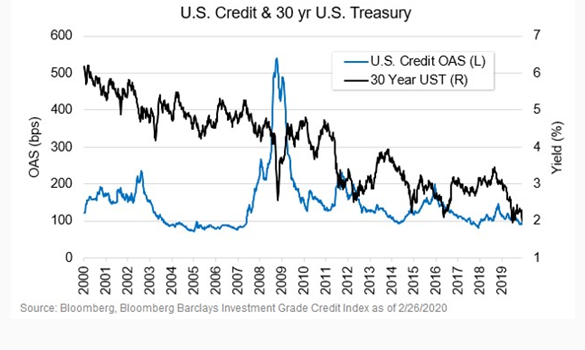
Source: Smith Capital Investors
The last week has produced one of the quickest market corrections in history, and like you, we want to stay on guard to protect portfolios in case a short-term correction evolves into a longer-term bear market. Right now, there are clearly caution flags, but also reasons which support looking for buying opportunities. At The Joseph Group, each of our purpose-based strategies is designed with a different objective in mind. As a result, we may be looking for opportunities in one strategy while we are continuing to hedge risk in another. Our mission is to help create great lives one story at a time. Regardless of whether markets are hitting all-time highs (like last week) or setting record point declines (like this week) when we focus on the purpose our clients have for their assets and then make sure their plan and portfolio are aligned with that purpose, it provides a lot of freedom in times of stress.
We love talking about how portfolios are doing and are always willing to share our thinking. We will continue to keep our clients posted with updates on our various strategies as we navigate the current environment, but please do not hesitate to reach out with questions.