Four Things We Are Focused On
October 14, 2022
To Inform:
Emotions are high when it comes to markets right now. There is a coffee shop in Hilliard called Coffee Connections which is one of my favorite places to work when I need to focus. It’s a terrific place – great coffee, terrific atmosphere, and amazing people. As I’m typing this, there is a group in the room next to me…I’m not trying to eavesdrop, but they are loud. They are talking about markets, and I just heard one person say, “I feel like the market is going to crash.”
Over the long-term, “I feel” are two words NOT typically associated with success when it comes to investing. Part of our job at The Joseph Group is to manage portfolios for the clients we are privileged to serve with a focus on objectives rather than emotion. It’s not easy when markets are volatile and are swinging by multiple percentage points not only daily, but within a day. That said, here are four key things we are focused on to provide a wider perspective:
Longer Term Inflation Pricing
Yesterday’s Consumer Price Index (CPI) number came in hotter than expected and markets went on a roller coaster with the Dow down over -500 points in the morning but up over +800 points by the afternoon close. Now the focus will shift to next month’s CPI number. We don’t pretend to know what November or December’s inflation number will be, but we do know the bond market is pricing inflation to come down over the long term.
The U.S. Treasury issues regular Treasury bonds and inflation protected Treasury bonds. If we take a 5-year Treasury bond and a 5-year inflation protected Treasury bond, the only words different in those two terms is inflation protected. In this case, the difference in rates between the two bonds reflects the market’s pricing of what inflation will average over the next 5 years. We prefer this 5-year breakeven measure for future inflation expectations because it’s not based on a survey or opinion, it’s based on actual market pricing. The chart below looks at the 5-year breakeven inflation rate over the last 18 months (since markets stabilized post-COVID). As you can see, the breakeven inflation rate peaked around March (shortly after the Ukraine invasion) and has been trending down ever since. The current level of 2.38% is close to the lowest level in a year and a half. Bottom line, even though we don’t know what next month’s inflation print will show, the bigger picture market pricing shows inflation trending down.
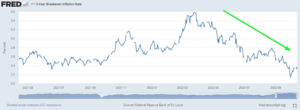
Source: St. Louis Federal Reserve
Credit Spreads on High Yield Bonds
According to the Wall Street Journal, today’s high yield bond “spread,” or interest rate over and above the government bond rate paid by junk bonds, is 5.31%. So, what does that mean? Let’s put the number in context:
- Higher is bad when you are looking at stress in the economy. The higher the number, the more the market is pricing credit stress.
- The median credit spread over the last 15 years is 4.85% with a range of 3.10% at the low and 21.47% at high (Source: Eaton Vance).
- Each recession over the last 30 years has seen the spread exceed 8.0%
- Recently, the spread peaked at 6% in late June
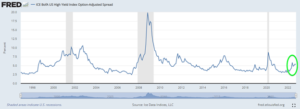
Source: St. Louis Federal Reserve
So, what can we derive from these facts? We are looking at the high yield bond spread as a proxy for pricing credit stress in the system. While elevated, pricing for credit stress is closer to the historical median than recessionary levels. And despite recent market turmoil, pricing for credit stress is lower (better) than what it was in June. Bottom line, credit stress would be a major red flag for the ability of things to “get worse” for markets and the economy. It would be noteworthy if the spread exceeded late June levels (6%) or historic recessionary levels (8%) but that’s not what the data is showing.
Investor Sentiment
We look at multiple measures of investor sentiment – put/call ratios, surveys, panic/euphoria indexes… but as long-time readers know, one of our favorites is the “Smart Money/Dumb Money” indicator. The name itself suggests logic over emotion – after all, everyone wants to be the smart money and not the dumb money, right? While not a perfect timing indicator, when behavior between the two group is at an opposite extreme, it suggests emotions are high (fear or greed), but the market is likely at a point where we want to avoid acting on emotion. A chart of today’s reading is below – the “smart money” is at an optimistic extreme while the “dumb money” is at a pessimistic extreme. Historically, this has been the sort of measure associated with excessive fear and a better long-term buying opportunity…which is a nice segue into our final point….
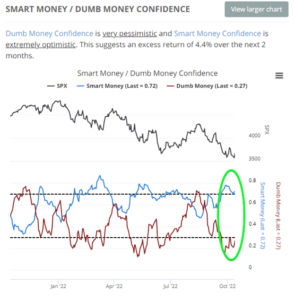
Source: Sentimentrader.com. Sundial Capital Research
Time Horizons
In his book, The Psychology of Money, Morgan Housel said, “If you want to do better as an investor, the single most powerful thing you can do is increase your time horizon.” Markets are rough today, but where are markets likely to be 3-5 years from now? At the risk of being self-serving, here is another quote:
“We believe the best way to successfully navigate (the financial turmoil) is to think in terms of two timeframes simultaneously. First, we need to acknowledge the reality we have never dealt with anything like this in modern economic times (ok, this is a stretch today, but go with the quote). There is no playbook or market history which can give us a definitive road map here and Congress is creating policy as it goes along. Second, we need to acknowledge we will get through this and there will be opportunities created from the dislocations. As market action is illustrating, prices for stocks, bonds, etc. are changing rapidly from day. Some of those price changes reflect shifts in fundamentals, but some of those changes also reflect computerized trading, liquidity challenges, and investor emotion. The “price” of the market today is not necessarily reflective of where things will be in one year and certainly not three years from now. Both time frames must be considered together – we cannot ignore the present situation, nor can we ignore the reality of the human desire to move through it and make things better.”
Travis Upton – Wealthnotes – March 25, 2020
So, I feel a bit weird quoting myself but having a career in the financial markets for 25 years, I have a few emotional times I can reflect on and staring down the barrel of the COVID market declines was one of them. The playbook then also speaks to the playbook now – making decisions focused on client objectives. Focusing on objectives acknowledges two times frames. The first timeframe accounts for the current political, interest rate, inflationary, and geopolitical challenges and makes sure client financial plans have resources in terms of liquidity and cash flow. The second timeframe focuses on the long-term and accounts for the fact people have an innate desire to make things better.
The last chart below comes from Russell Investments and looks at the worst 1-year decline for a portfolio consisting of 40% U.S. Stocks, 20% International Stocks, and 40% High Quality bonds by decade. It then looks at the subsequent 1-year, 3-year, and 5-year return following that decline.
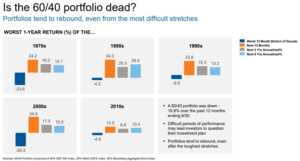
Source: Russell Investments
The market’s recent performance is about in the middle of the 5 decades shown here – not as bad as the worst declines of the 1970’s or 2000’s, but worse than the 1980’s, 1990’s or 2010’s. Regardless of the decade, and regardless the headlines – war, inflation, rates, earnings…a longer time horizon, especially after a decline, has tended to reward investors.
Those are the four key things we are focused on market-wise. When it comes to planning, we are focused on one thing – changing clients, “I feel statements” from “I feel like the market will….(insert view here)” to “I feel like my big picture plan is prepared to weather the current storm and is positioned for long-term success.”

Written by Travis Upton, Partner, CEO and Chief Investment Officer