Is It So Bad It Could Be Good?
May 27, 2022
To Inform:
Over the last two days I had the opportunity to attend an investment conference in Newport, Rhode Island. It was a smaller, more intimate gathering consisting of financial advisors and fund managers from across the country. At dinner last night I talked to a former executive from Lehman Brothers during the 2008 financial crisis, a familiar face from financial TV, and a good friend from Columbus who was also attending. The conference organizer opened the gathering by saying she hoped it would be a “think tank” and an opportunity to share ideas and learn from one another. On that front, the conference did not disappoint.
A major theme from discussions is the thought that investor sentiment is worse than the economic data. The mood of investors is awful right now. With inflation, record gas prices, rising interest rates, war, politics…consumer sentiment surveys are terrible. However, a big theme from conference speakers is the actual numbers behind the economic data are not as negative as what the mood of gloom would dictate…conditions which could set the market up for positive surprises in the months ahead.
We see this pessimism reflected in one of our favorite sentiment measures – the Smart Money/Dumb Money indicator. The idea is to follow the “smart money” institutional investors and do the opposite of the “dumb money” more emotional individual investors. When there is a big gap between the red and blue lines, it can be a signal the market is leaning too far in one direction. Recently, we’ve seen data of increased buying by corporate insiders (an example of so called smart money), something that contrasts sharply with the mood of individual investors.
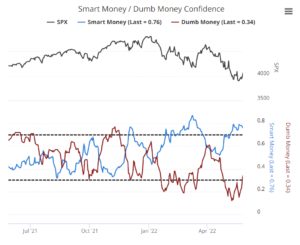
Source: Sentimentrader.com, Sundial Capital Research
Sentiment itself is not a perfect timing indicator, but when pessimism is at an extreme, it reflects conditions where the market may respond favorably to positive surprises. So, where could a positive surprise come from? That brings us to our second chart – inflation.
Market data over the last couple of weeks has shown a sharp move downward in future inflation expectations. The white line in the chart below reflects the bond market’s pricing of long-term inflation expectations based on the difference in interest rates between regular and inflation-protected Treasury bonds. A couple of weeks ago, the bond market was pricing inflation over the next 10 years to average 3%…today, it is pricing inflation to average 2.6%. These long-term numbers are not only lower than the 8% headline numbers, they are moving down from their highs. In a market where participants are expecting things to get worse, the market pricing of inflation is likely a positive surprise.
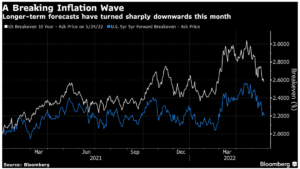
Source: Bloomberg
Inflation and the potential for recession were hot topics at the conference. There was an idea that if inflation comes down, the Fed may not have to raise interest rates at the levels expected later this year, which in turn increases the odds the economy can avoid recession. And while that positive outcome is far from certain, it’s one which is not currently priced into the markets.

Written by Travis Upton, Partner, CEO and Chief Investment Officer