Mid-February Market Observations
February 19, 2021
To Inform:
Earlier this week I had a call with a client and he said, “I’ve been away and haven’t been following the markets too closely. I only have about 10 minutes – what is important for me to know?” We had a terrific brief conversation which focused on four key points, and I’ll share that discussion here.
Interest Rates on Longer Term Bonds are Rising
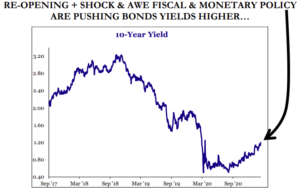
Source: Strategas Research Partners
While still low in a historical context, interest rates have made a significant move higher in the last few weeks. At the beginning of the year, the interest rate on the 10-year Treasury note was 0.92%, while this week the rate is 1.32%. It’s a huge move in six weeks’ time and has both positive and negative market implications. On the plus side, higher rates are indicative of a stronger economy, propelled forward by stimulus, vaccines, and the prospect of reopening. However, the rate on the 10-year Treasury note influences things like mortgage rates, and those rates look like they are headed higher.
Rising Inflation Expectations Are A Driver for the Rise in Interest Rates.
We’ve written about indicators for rising inflation a few times recently, including Alex Durbin’s brilliant Wealthnotes last week discussing reflation (Reflation Everywhere – The Joseph Group).
We can look at the market’s expectations for future inflation based on the TIPS (Treasury Inflation Protected Securities) market and right now, the TIPS market is pricing in inflation to average about 2.25% for the next 10 years. Back in October, the market was pricing in inflation to average about 1.65%, so this is a significant move since the election. How does this impact us in the “real world”? I definitely noticed that when I filled up my gas tank this week, the cost on the pump was the highest I’d seen in some time.
Sentiment is Indicating “Greed” in the Market
One of our favorite gauges of investor behavior is the “Smart Money/Dumb Money” indicator. The idea is to follow the “smart money” option traders and commercial hedgers, but do the opposite of the “dumb money,” more emotional individual investors. Most of the time the data is just noise, but when there are big extremes with the two groups moving in opposite directions, it’s noteworthy.
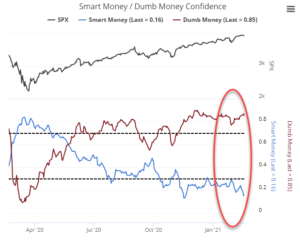
Source: SentimenTrader.com
With regard to current readings, we would say two things. First, the Smart Money/Dumb Money indicator is showing a significant caution flag with the smart money moving in the opposite direction from the dumb money’s extreme optimism. However, the second thing we would say is the indicator is much better at timing market bottoms than market tops. We saw an extreme in the other direction with the Smart Money buying and the Dumb Money selling last March, and in hindsight, it was an excellent buy signal. The conditions we are seeing now can persist for a long time (the extreme has already been in place since the election) so it does not necessarily mean a correction is imminent.
So, what do we do about it? The sentiment caution flag is enough though to make us thoughtful about using hedged stock funds to help cushion against volatility as well as take a dollar cost averaging approach to adding new funds to the market.
The Stock Market Does NOT Look Like March of 2000.
Finally, I shared that with sentiment looking extreme, one of the big concerns we are hearing is whether current market conditions look like the “technology bubble” from 20 years ago. March 24, 2000 marked the peak of the technology/internet bubble and the start of a bear market for the S&P 500. Strategas Research Partners made an interesting observation comparing how behavior across different sectors of the market looked then versus today.
Below is a chart of what the trend and momentum in different sectors looked like on March 24, 2000. Basically, the trend and momentum had rolled over and was negative for almost every sector of the economy, with technology and telecom being the last to deteriorate. In other words, the broader market was already pointing to economic weakness ahead.
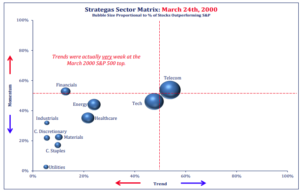
Source: Strategas Research Partners
Now, let’s contrast March 24, 2000 with the same chart for February 12, 2021 (last week). Sector trends and momentum are strong across the board, and in our opinion, the weakest sector, utilities, is being pressured more by rising interest rates than current economic troubles.
The bottom line is market behavior is much more consistent with strong economic growth than a market that is pointing to potential weakness ahead. Technology stocks may have led performance recently, but conditions do NOT look similar to March of 2000.
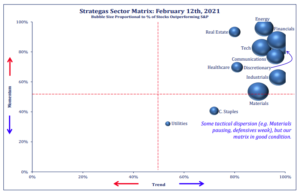
Source: Strategas Research Partners
Putting it all together, I would say six months ago investors hoped for growth and recovery, but now the reality of that growth and recovery happening is being priced in. We’re at a later stage in the cycle, but that’s not a bad thing.
Have a great week!

Written by Travis Upton, Partner, CEO and Chief Investment Officer