New Highs for US Stocks – What Do We Want to See Next?
April 25, 2019
To Inform:
Earlier this week, the S&P 500 index officially closed at a new all-time high, eclipsing the last high achieved on September 20th of last year. Courtesy of Yahoo Finance, here is what the chart of the S&P 500 looks like from September 20th of last year through the close on April 23rd of this year: a big V shape with a 19% correction in between that only roller coaster enthusiasts would enjoy.
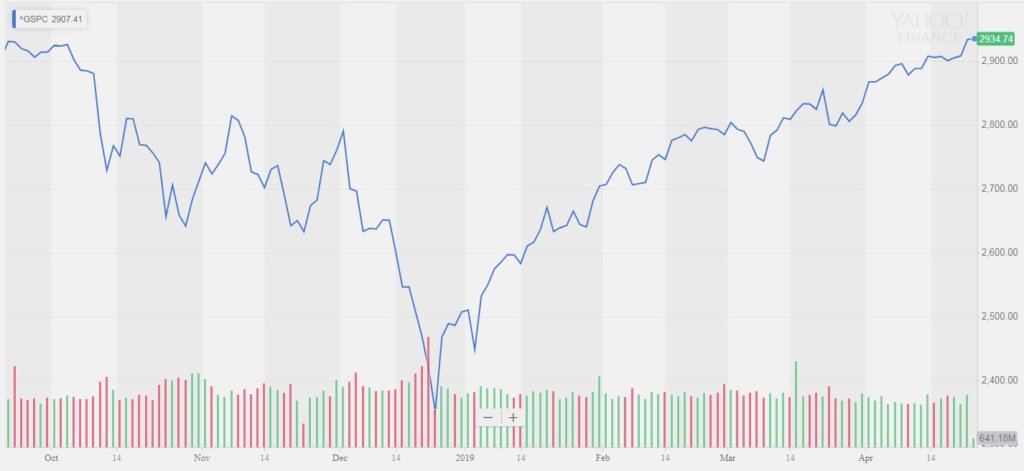 Source: Yahoo Finance
We are glad to see the index hitting new highs, but in order to have confidence that the market can continue to advance, we want to see more individual stocks participating in those new highs.
So, what do we mean by that statement? The chart below provides a good illustration. The chart shows the 500 stocks within the S&P 500 at the beginning of the day on April 23rd and the distance of each stock from their 52-week high. While the S&P 500 was less than 1% away from a new high (which it achieved at the end of the day on 4/23) the average stock in the index was still more than 12% away! In other words, the index may be hitting a new high, but the average stock still has a ways to go to achieve the same feat.
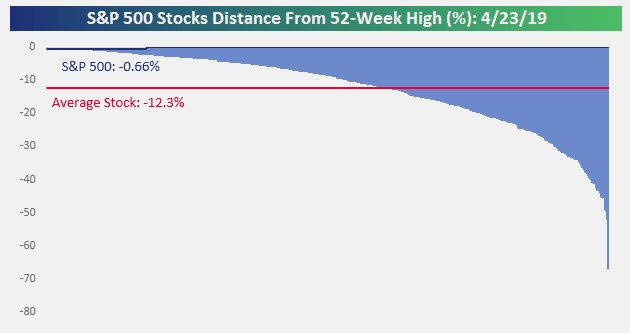 Source: Bespokeinvest.com
Why is there such a disparity between the index recovery and the average stock recovery? Simply put, not all stocks have rallied as much as some of the big stocks which have the highest weight in the S&P 500 index.
Let’s look at an example to explain what we mean. The best performing sector so far in 2019 is Technology, and a Technology index which tracks this sector this year is up over 25% YTD. On the other hand, the worst performing sector this year is Health Care and the sister index which tracks the Health Care sector is up less than 1%. Clearly, that’s a big gap. What does that have to do with the S&P 500 index as a whole? Of the 10 largest stocks in the S&P 500, 5 of them are big technology names and those names are giving an extra “push” to the index, which is not necessarily being experienced by the average stock.
Bottom line – we like seeing new highs and what those new highs mean for returns in client portfolios. However, in the weeks ahead, we want to see more individual stocks hitting new highs along with the index.