Thoughts on Recent Market Correction
October 12, 2018
To Inform:
There are two types of market corrections and anytime market volatility is more extreme than usual, we always need to be asking which of the two types of correction might be happening.
- A technical or “fear” based correction is typically fast, furious and short lived. There is typically some sort of headline/catalyst (i.e., rising interest rates) which provides a “reason” for the correction and fuels negative emotions. These types of corrections are typically constrained to certain areas of the financial markets (mostly stocks), are exacerbated by computerized trading, and don’t necessarily have broader fundamental implications for the economy. Market history would say it is common for one or two of these corrections to happen each year with the average pullback being about 13.8% (source: JP Morgan). With these types of corrections, our playbook needs to be looking for changes in leadership (i.e., a shift away from tech stocks) and take advantage of the opportunity presented by lower prices in the midst of a long-term uptrend.
- A “recessionary” correction is bigger, longer lasting and causes the kind of damage to portfolios which can impact long-term financial plans. With these types of corrections, the impact spreads across different markets and the broader economy. Activity in credit markets is especially important as virtually every major “recessionary” correction has been preceded by a massive credit crisis. These types of corrections require a different playbook where we need to play defense – either shifting more toward government bonds if the recession is “deflationary” or shift toward real assets if the recession is “inflationary.”
So, with the Dow declining over 1,300 points in two days, which of the two types is this?
- As I am typing, the market is not yet open, but futures on the popular Dow index are up about 400 points and earnings releases from a couple of major global banking institutions have topped expectations.
- Credit spreads have been relatively contained the last few days – we are NOT seeing anywhere near the kind of activity that would indicate greater stress on the banking/financial system.
- Action in the bond market is more consistent with economic growth and potentially inflation, but NOT with recession. In fact, we’ve gotten a lot of questions over the last six months about an “inverted yield curve” where short-term rates move higher than long-term rates. An “inverted yield curve” has historically been one of the most reliable harbingers of recession, and as the difference between short-term and long-term rates has narrowed, it has become a bigger concern. With the recent rise in long-term rates, the yield curve has actually steepened. That’s a lot of investment talk, but the bottom line is that an inverted yield curve flashing a warning sign is actually further away today than it was a couple of weeks ago.
- The big picture “trend” in the market remains positive. Market technicians have different ways of defining “trend,” but the moving average definition we use along with a couple of our research partners remains positive. The recent decline is meaningful, but has not been enough to trigger a “red alert.”
We can cite numerous other data points but the bottom line is that Playbook #1 – this is a technical or “fear” based correction – is what lines up with the data. It is worth noting our Investment Strategy Team recently devoted a meeting to “what we would do in portfolios if we wanted to shift to defense?” The data is not telling us it’s time to shift to Playbook #2, but clients should know we’ve drawn up the diagrams.
There are two more points for context around this market that we think clients might find interesting
1. Seasonality. There is a term called an “October Surprise” on Wall Street and it refers to the fact that some of the market’s most volatile periods and biggest corrections often come in the month of October. Surprise! However, another seasonal occurrence is approaching and that’s seasonality associated with a mid-term election year. As the chart below shows, seasonality tends to be much stronger than average for stocks in mid-term election years (like this one) and that positive seasonality often starts in mid-October.
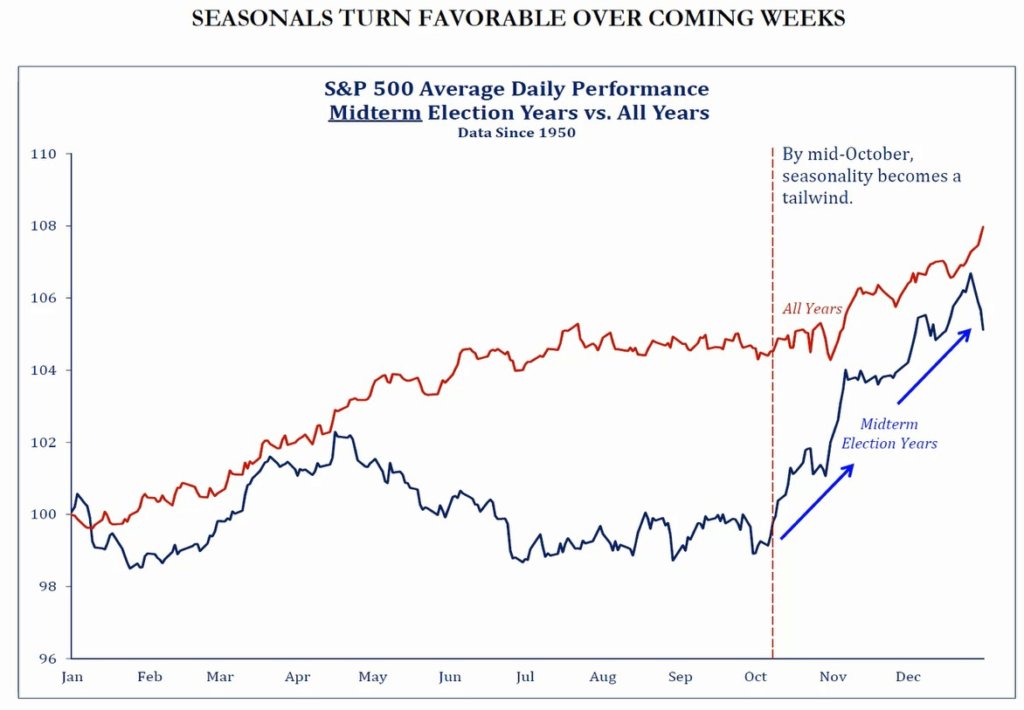 Source: Strategas Research Partners
It is important to note that seasonality paints with a broad brush (averaging many years and even decades together) and that each year is its own year.
2. Markets and the Media. Jason Goepfert from SentimenTrader sent out a tweet yesterday that we found fascinating and humorous all at the same time. The last two days we have seen headlines using emotionally charged words such as “massive” and “plunge.” Goepfert did a study looking at the 3-month return following a “CNBC Special Market Report,” and according to his study, the market was positive 11 out of 12 occurrences with a median return of +5.4% after the use of either word in the headline of such reports. The bottom line – it’s easy to say “don’t get swept up in the media” around these corrections, but Goepfert has numeric proof.
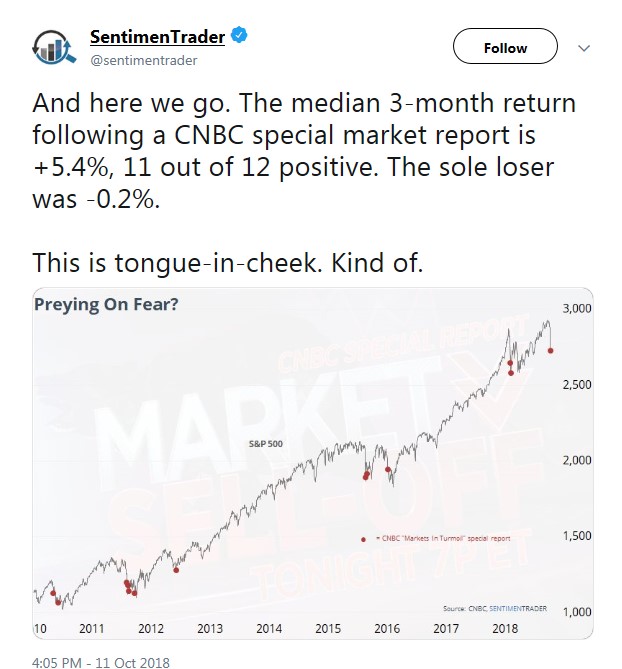 Source: SentimenTrader, Twitter
So, taking logic rather than emotion, we are still working with Playbook #1 – this is a correction in an uptrend. We are looking for signs of changes in leadership within the stock market (we have a theory that value/dividend stocks start to outperform growth stocks), we are looking for opportunities to use volatility to make tax-savvy moves in client accounts, and we are constantly looking for data that might tell us it’s time to switch to Playbook #2.