What a Difference Six Weeks Makes
July 29, 2022
To Inform:
Last night I had the privilege of attending the meeting of a local investment partnership. This group of savvy business owners and professionals meets monthly to enjoy amazing food, allocate capital within their investment fund, and serve as a “think tank” for local and global economic conditions. Part of the meeting involves reviewing each of the individual holdings within the partnership’s portfolio. As discussion went around the table, one thing was clear immediately – virtually every holding in the portfolio had moved higher compared to levels from the group’s previous meeting in June.
For those following markets closely, this may not be a surprise. The S&P 500 made it’s bottom so far for 2022 on June 17 at a level around 3,620, but in the last six weeks, has rallied over 10%. While stocks (and most other areas of the financial markets) are still down from the beginning of the year, the rally off of the lows is certainly welcome to most investors. It begs the question though, what’s different from six weeks ago? Here are several observations:
Gas/oil prices are down. One of the participants at last night’s meeting said “I just filled up my truck for $3.69!” Obviously, that’s a significantly lower price than the over $5.00/gallon Central Ohio residents were seeing at the pump earlier in the summer. Oil prices are also down. Today’s price for a barrel of crude oil is about $98, compared to a level of $122 in early June. Ironically, the recent bottom in stock prices lines up within days of the peak in gasoline prices (see chart below).
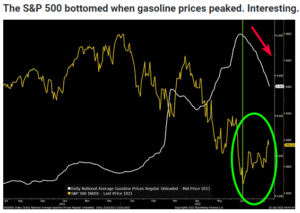
Source: Bloomberg, Hamilton Lane
Longer term inflation measures are coming down. While current measures of inflation remain high, long term measures of inflation have come down and are hovering around levels which persisted throughout 2021 when the word “inflation” was not in the media as much as it is now. The chart below comes from the St. Louis “Federal Reserve Economic Database” (or FRED) and looks at the 5-year breakeven inflation rate implied by inflation protected bonds. Essentially, this is a measure of what the bond market is pricing in inflation to average over the next 5 years. The current level of 2.67% is not only lower than June’s level of 3.1%, it is significantly lower than March’s post-Ukraine invasion level of close to 3.6%.
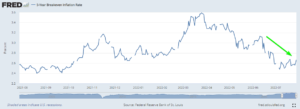
Source: St. Louis Federal Reserve
Credit conditions have improved. We look at the interest rate high-yield (junk) bonds pay over and above government bond rates (called a spread) as a measure of credit stress in the economy. The higher the spread, the more credit stress is being priced into the economy. Today that “spread” is 5%, a full percentage point lower than the 6% level hit on June 13. What this tells us is that even if the economy is already in or goes into a recession (a big debate right now in economic circles), the impact is expected to be mild as credit conditions remain at levels much healthier than prior recessions (or even slow-downs).
Short-term interest rates are up… The Federal Reserve increased the short-term Fed Funds rate by 0.75% on June 15 and then by another 0.75% on July 27. The Fed directly sets short term rates, however, the market controls long-term interest rates. Which brings us to….
…but Long-term interest rates are down. The 10-year Treasury note is considered a key benchmark for longer term interest rates and has as a heavy influence on longer term borrowers and things like mortgage rates. Below is a chart of the 10-year Treasury note rate since mid-June. After hitting an over decade level high on June 14th of 3.49%, as I type on July 29th, the 10-year Treasury rate currently sits at 2.66%. The decline in rates has been a big positive for bond investors as bond prices move in the opposite direction of interest rates. Not only are stocks up since mid-June, but the Bloomberg Aggregate bond index is up close to 4% since June 17th as long-term interest rates have declined.
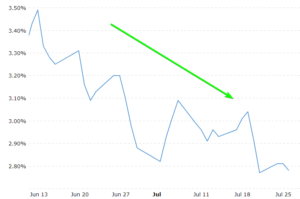
Source: Macrotrends.net
This may beg the question – if short term rates are rising, why are longer term rates going down? One factor is likely a change in expectations regarding what the Federal Reserve may do in the future. The chart below looks at expectations of what the Fed will do in 2023. With the economy showing some signs of slowing, the market is now pricing in 0.75% of rate CUTS in 2023.
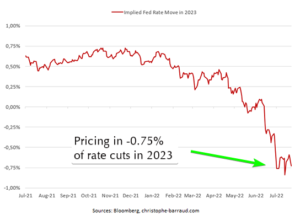
Source: Bloomberg, Hamilton Lane
What hasn’t changed much is corporate earnings estimates. A lot has clearly shifted within the financial landscape within the last six weeks, but one thing which has not changed much is estimates of future corporate earnings. Earnings estimates for next year have come down with concerns of an economic slowdown. However, as actual earnings have come in, in many cases, the numbers are not as bad as many investors have feared. Currently, companies in the S&P 500 are expected to earn an aggregate of $244 in 2023 down from a high of $248. In other words, earnings expectations are down about -1.6%. With the S&P 500 down -13.8% for the year through July 28th (and at one point was down well over -20%) a lot of bad news is priced in. If earnings end up being better in reality than what investors fear, it could set the stage for a further upside surprise.
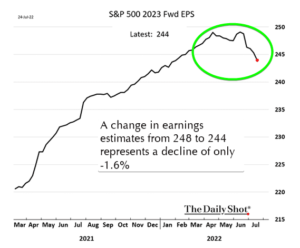
Source: The Daily Shot
Last night’s investment partnership dinner wrapped up with a key question for investors: “do we want to hold more cash, or do we want to put money to work?” One participant mentioned the historic tendency of markets to have a stronger period in the final few months of a mid-term election year (discussed in a previous Wealthnotes). There is clearly A LOT happening in the world, but putting a positive seasonal tendency together with declining inflation and potentially stabilizing earnings could continue to provide a more positive tone to markets as we move toward latter months of 2022.

Written by Travis Upton, Partner, CEO and Chief Investment Officer