What is the Market Saying About Inflation?
August 19, 2020
To Inform:
Last week’s Portfolios at Your Place Event covered Capital Market Assumptions (CMA) – a fancy term for forecasts of future asset returns over the next 5-10 years based on fundamental data like dividends, interest rates, and valuations. Many large investment banks and asset management firms put out annual forecasts of Capital Market Assumptions put together by their economists and analysts. We summarized the output from five well known firms and talked about where the forecasts were similar and different and the implications for long-term asset allocations. For those unable to attend last week’s event, here are two of the most important takeaways:
- All five firms putting together CMA forecast U.S. Government bonds as their worst performing asset class over the next 5-10 years. With starting interest rates for government bonds being so low (the current 10-year government bond rate is 0.67%) the outlook for future returns is also low.
- The forecasts for the best performing asset classes over the next 5-10 years were emerging market stocks and global infrastructure (think cell towers, toll roads, oil pipelines, and the energy grid).
During the Capital Market Assumptions discussion, we raised the point that inflation, and whether it rises or falls, could have big implications for how different asset classes actually perform. I made the point that the market is “current pricing in inflation to average about 1.6% over the next 10 years which is still historically low.” An attendee to our Zoom event astutely asked, “where are you getting that number – that the market is pricing in inflation to average 1.6% over the next 10 years?” The answer to that question is the lesson embedded in this edition of WealthNotes.
First, some technical background – bear with us. The U.S. Government issues two key types of Treasury bonds. The first type is the simple straight-forward Treasury bond. An investor buys the bond, is paid interest during the life of the bond, and receives their principal back at maturity. Within this type of bond, there is no adjustment for inflation, so inflation is presumed to be priced into the bond. The interest rate is said to be “nominal” which means there are two components within it – a real interest rate and an implied inflation rate.
The U.S. Government also issues Treasury Inflation Protected Securities, or TIPS for short. Like conventional Treasury bonds, these bonds pay interest (but the rate is much lower) and the investor receives their principal back at maturity, but each year, the bond’s principal value is adjusted for inflation. Since there is an explicit inflation adjustment to the bond’s principal value and the interest rate is applied to this bond’s inflation adjusted value, the interest rate on the TIPS bond is a “real” interest rate, meaning it has been adjusted for inflation.
Now, with that background, let’s make this simple and get to the point. If the U.S. Government issues a regular 10-year Treasury note and a 10-year TIPS note, they should be mathematically equivalent because they are issued by the same entity and have a similar time to maturity. However, these bonds have different stated interest rates because one is inflation adjusted and one is not. Regular Treasury bonds have a nominal interest rate (real rate + implied inflation) while TIPS only have an inflation-adjusted, or real rate. Therefore, doing some quick math:
(Real Rate + Implied Inflation Rate) – Real Rate = Implied Inflation Rate
Or, saying it differently,
Regular Treasury Bond Rate – TIPS Bond Rate = Implied Inflation Rate
If we take the 10-year Treasury bond rate and subtract the rate on 10-year TIPS, we are left with the market implied 10-year inflation rate!
So, now that you know the math, let’s look at some real time data and apply this concept using data from the Wall Street Journal Market Data Center.
The regular Treasury bond which matures on August 15, 2030 (about 10 years from now) has an interest rate of 0.676%. The TIPS bond which matures on July 15, 2030 has a stated interest rate of -0.973%. (Note the negative interest rate means investors see the inflation adjustment as the most important piece of these bonds).
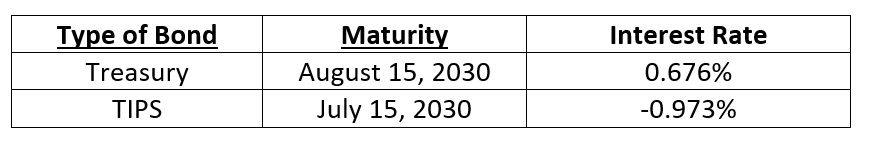
Source: https://www.wsj.com/market-data/bonds/treasuries, https://www.wsj.com/market-data/bonds/tips
Doing the math, the implied 10-year inflation rate is currently 0.676% – (-0.973%) = 1.65%. In other words, the market is currently pricing in inflation to average 1.65% per year over the next 10 years, as that is the rate which will make these two bonds issued by the U.S. Government mathematically equivalent.
If you really want to impress your friends at a party, tell them you know how to calculate the market implied inflation rate.
Now that you know the calculation, here are a couple of quick application points:
- The market implied inflation rate changes over time as interest rates change. As you can see from the top line in the chart below, inflation expectations cratered when COVID-19 hit, but have recovered to their current 10-year implied rate of 1.65%.
- If inflation accelerates, TIPS should outperform regular Treasury bonds as the inflation adjustment will get more valuable.
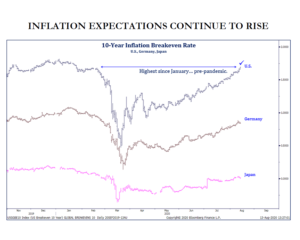
Source: Strategas Research Partners
Every financial plan is different, but when we construct plans for clients, we are typically using 2.5% as an assumed inflation rate, meaning we are more conservative (erring on the side of higher inflation) than what the market is currently pricing in. Also, our diversified portfolio strategies, such as Harvest and Provision, contain a “Real Assets” allocation, which includes assets like Global Infrastructure which are more sensitive to inflation and may perform well in periods when inflation is rising.
At the Joseph Group, everything we do is focused on achieving our clients’ purpose. Inflation is just one of many components where we seek to create alignment between the portfolios we manage and the financial plans we create to support that purpose.