Will Santa Claus Bring a Post-Election Gift?
October 25, 2018
To Inform:
October has been a rough month for the markets, to say the least, but in a few weeks, we are about to enter what historically has been one of the best 9-12-month periods for the stock market. In the midst of the market turmoil, is Santa Claus getting his sleigh ready to bring gifts for investors?
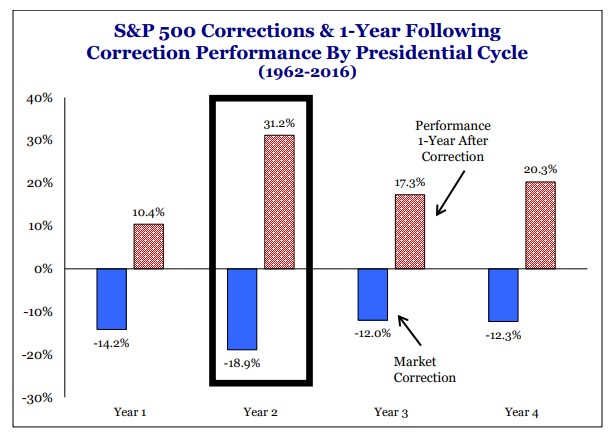
History shows mid-term election years (like 2018) have been notorious for market volatility. The chart below goes back to 1962 and shows corrections and performance 1 year later for different years of the presidential cycle. In Year 2, (which lines up with where we are in the current cycle), the average correction for the S&P 500 is -18.9%, more than any other presidential cycle year – that’s the bad news. The good news is that the average recovery coming out of that correction is also more than any other presidential cycle year – over 31%.
 Source: Strategas Research Partners
How does that line up with what’s happening today? The S&P 500 peaked on September 20th at a level of 2,930. On October 24, the S&P hit a low of 2,656, for a correction of 9.4% in about four weeks. So, what we’ve experienced so far is only about half of the average, but to be fair many sectors and stocks within the S&P have experienced a much bigger correction than the index.
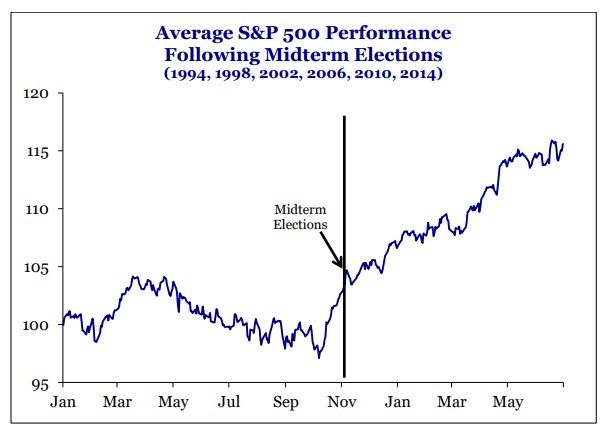
Ok, so if the historical comparisons show a recovery, when does that recovery usually start? Below is a chart that looks at the pattern over the last 20 years for the last six mid-term election years. How did history play out? Looking at the line in the chart, the market has historically had a correction around February (hmmm…), a recovery, a choppy market through the summer, hits the lowest point for the year in October, then starts to recover and then rally in the six months after the elections.
 Source: Strategas Research Partners
Now, we don’t want to be lulled into complacency by historical comparisons, and we absolutely want to consider what is happening with earnings, interest rates, and tariffs. However, the similarities between history and what we are seeing today are compelling. It almost feels like Wall Street is acting like Hollywood and doing another remake. If nothing else, if the economy truly is starting to weaken, seasonality may give us a chance to reduce stock exposure in portfolios later in the year from a position of strength rather than reacting to headlines.
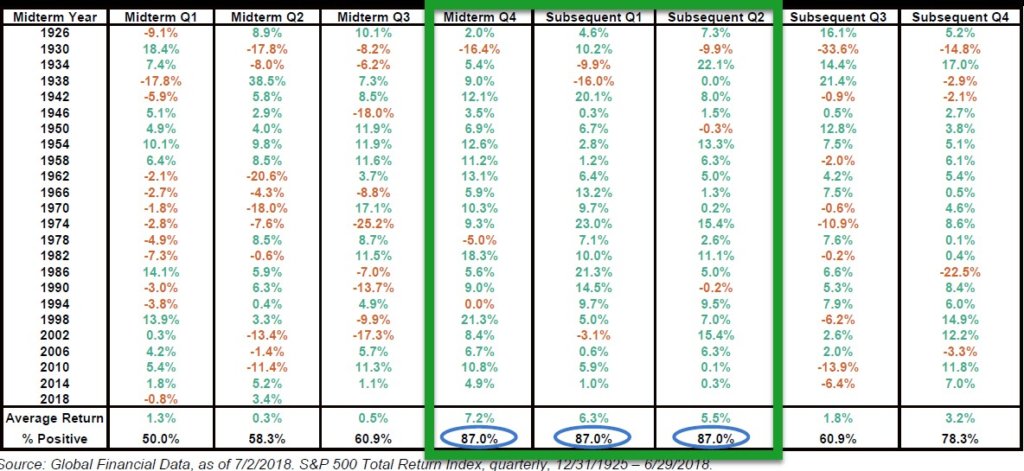
Finally, some people may say “charts above are great, but they look at averages – any given year can be different.” That’s definitely true, so for those who want to dig into the data, here are the quarterly returns for every mid-term election year and subsequent year going back to 1926. In the post-World War II era, returns have been above average and positive more often regardless of who was president.
 Source: Fisher Investments
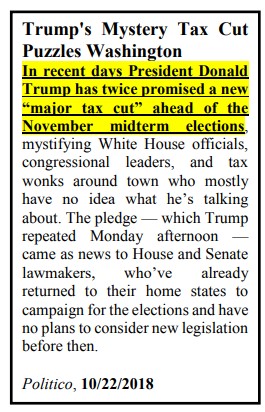
When you annualize the data, the S&P 500 has not declined in the 12 months following a midterm election since 1946. According to Strategas’ Head of Policy Research, Dan Clifton, “In our view, this is not some small data point coincidence. Our belief is that presidents worry about their own reelection following the midterm election and push for more fiscal policy. In the year following the midterm election the equity market prices higher economic growth that results from new fiscal policy.” In light of Clifton’s comments, we found the following headline interesting.
 Source: Strategas Research Partners
Bottom line, what would history say about the current environment? If the future is anything like the past, scary things come out around Halloween, but ultimately, Santa Claus comes to town.